Investigation 1: The Excitement of Exploration
Quotes from a great oceanographer:
The sea, once it casts its spell, holds one in its net of wonder forever.
—Jacques Cousteau
What is a scientist after all? It is a curious man looking through a keyhole, the keyhole of nature, trying to know what's going on.
—Jacques Cousteau
Investigation 2: Canyons in the Sea
One-minute video of undersea footage of Pribilof and Zhemchug canyons
Ocean exploration is expensive, and seasons in which expeditions are safe and possible are restricted (students could be asked to identify some of the difficulties). This is very true in the Bering Sea with drifting ice, low temperatures, high winds, and remote locations. The Bering Sea also has varied geological formations, including seamounts and canyons, and at very low depths there is no light. This means scientists must plan their strategies carefully to get the maximum data in the minimum amount of time with the best possible accuracy. Researchers have developed technology for taking samples from a sea bottom and then drawing conclusions about the community as a whole. (Do the samples really represent the whole?) Organisms could be hidden under rocks or in sediment, or are very small, or very large, or very fast. Scientists used to take grab samples from the bottom with a clamshell tool somewhat like a steam shovel head. But how do you decide where to make the grabs in the vast space available? (Maybe have students give ideas.) New technologies, including remotely operated vehicles (ROVs) underwater video recorders, high-resolution digital cameras, and sidescan sonar are used on ocean scientific expeditions. Despite the new technology, the researchers know that some organisms go undetected.
Investigation 3: Mountains in the Sea
Seamounts
The following information is from http://www.oceanexplorer.noaa.gov, 2004 Gulf of Alaska Expedition.
Volcanoes that can form seamounts are often associated with the movement of the tectonic plates that make up the Earth’s crust. Where these plates move apart (for example, along the mid-ocean ridge in the middle of the Atlantic Ocean) a rift is formed, which allows magma (molten rock) to escape from deep within the Earth and harden into solid rock known as basalt. Where tectonic plates come together, one plate may descend beneath the other in a process called subduction, which generates high temperatures and pressures that can lead to explosive volcanic eruptions (such as the Mount St. Helens eruption which resulted from subduction of the Juan de Fuca tectonic plate beneath the North American tectonic plate). Volcanoes can also be formed at hotspots, which are thought to be natural pipelines to reservoirs of magma in the upper portion of the Earth’s mantle.
In the late 1960’s, biologists searching for new commercial fishing grounds discovered that seamounts have high biological productivity compared to surrounding ocean waters, and provide habitats for a variety of plant, animal, and microbial species, many of which were previously unknown. Deep-sea corals are often conspicuous, and provide essential habitat for other organisms in seamount ecosystems. Seamounts and plateaus near Australia and New Zealand were found to have large populations of deep water fish with firm, tasty flesh. One species, the orange roughy (Hoplostethus atlanticus), is now common in North American markets. But fish stocks on seamounts were quickly diminished by commercial fishing vessels. Some studies report that deep-water trawlers have reduced orange roughy populations by as much as 90%. In addition, bottom trawling severely damages entire bottom communities: trawling is known to have removed 85% of the living cover from some seamounts (Malakoff, 2003). In February 2004, concern for this large-scale destruction of virtually unexplored ecosystems led 1,136 scientists from 69 countries to release a statement calling for governments and the United Nations to protect deep-sea coral and sponge ecosystems.
The seamounts are biological "islands" in the deep ocean that often feature characteristic organisms that are quite different from those found in the surrounding deeper habitats.
Compared to the surrounding ocean waters, seamounts have high biological productivity, and provide habitats for a variety of plant, animal, and microbial species.
Mapping the Ocean Floor
The following info is from Exploring Alaska’s Seamounts, NOAA Ocean Explorer, http://www.oceanexplorer.noaa.gov
The first order of business for scientists on the R/V Atlantis was to use multibeam swath bathymetry to create detailed pictures of the seamounts they wanted to study. Multibeam swath bathymetry (also called high-resolution multibeam mapping) uses a transducer (a sort of combination microphone/loudspeaker) mounted on the ship’s hull to send out pulses of sound in a fan-shaped pattern below the ship, and then records sound reflected from the sea floor through a set of narrow receivers aimed at different angles on either side of the ship. This system collects high resolution water-depth data that can distinguish differences of less than a meter. The system also measures the amount of sound energy returned from the sea floor (called backscatter), which can help identify different materials (such as rock, sand, or mud) on the sea floor. The multibeam system is coupled to a global positioning system (GPS) that can pinpoint sea-floor locations within one meter. All data are collected in digital form, which allows them to be processed by computer to produce maps, three dimensional models, or even fly-by videos that simulate a trip across the area being mapped in a high-speed submersible!
NOAA Ocean Explorer Expeditions has a lot of information, photos, videos, and more about these seamounts from their 2004 expedition. Browse this expedition site for more useful resources.
Activity 3A: Bathymetric Mapping
Background information from NOAA’s Ocean Explorer Learning Ocean Science through Ocean Exploration, www.oceanexplorer.noaa.gov.
Topographic maps are tools used by anyone in need of knowing his/her position on Earth in relation to surrounding surface features. A topographic map is a two-dimensional map portraying three dimensional landforms. Geologists, field biologists, and hikers are just a few who routinely use topographic maps.
Bathymetric maps (also called charts) are topographic maps of the bottom features of a lake, bay or ocean. They are very similar to topographic maps in their terminology and interpretation. The primary difference is that bathymetric maps show depth below sea level while topographic maps show elevation above sea level. Another difference is the limited data available to create a bathymetric map when compared to a topographic map. The skill needed to see two dimensions on a map and visualize three dimensions can be a difficult for students. Interpreting familiar topographic maps provides practice in this skill. This exercise will build an understanding of the relationship between a two-dimensional representation and a three-dimensional landform. Both topographic and bathymetric maps use contour lines to show elevation or depth. Contour lines are imaginary lines connecting points of the same elevation or depth. A contour interval is the predetermined difference between any two contour lines. A contour interval of 100 feet means that the slope of the land or sea bottom has risen or declined by 100 feet between two contour lines. A map that shows very close contour lines means the land is very steep. A map that has wide spacing between contour lines has a gentle slope. The smaller the contour interval, the more capable a map is of depicting finer features and details of the land. A contour interval of 100 feet will only pick up details of features larger than 100 feet. It also means that a seamount could be 99 feet higher in elevation than the map depicts. Because one cannot usually easily see beneath the water, the difference between what is mapped and the reality of what actually exists is greater on bathymetric maps. With the advent of new, more sophisticated ocean floor sensing technology, bathymetric maps are becoming much more detailed, revealing new information about ocean geology.
Acoustics
Sonar is short for “sound navigation ranging,” and uses sound waves to locate underwater objects by analyzing the echo that is bounced off the seafloor or other objects and reflected back to the sound’s source. Sound waves are transmitted through a transducer, which is analogous to a speaker in a radio. Side-scan uses a transducer housed in a hollow container called a towfish that is towed through the water 10 to 20 feet above the bottom. The transducer emits sound waves to either side of the towfish, and continuously the strength of the return echo to create an of the ocean bottom. These measurements are processed into an image that resembles an aerial photograph, and can be viewed in real-time on a computer monitor aboard the towing vessel. Images produced by echoes from hard objects (such as rocks or shipwrecks) are darker than images produced by echoes soft objects (such as sediments).
A differentially corrected global positioning system (DGPS) is used to guide the towing vessel along predetermined search paths, as well as to identify points of interest on the side-scan image. This allows searchers to return to any point on the image for further investigation. Side-scan sonar does not depend upon light and can be used under conditions that would make searching by divers dangerous or impossible. Because it typically covers a swath of 60 to 120 feet at about 2 miles per hour, it is a very efficient way to search large areas. For these reasons, side-scan sonar has been used increasingly over the last few years to search for drowning victims.
Most side scan systems do not provide information about depth. Multibeam sonar systems measure and record the time for an acoustic signal to travel from the transducer to a reflecting object and back to the receiver (rather than measuring the strength of the return echo as in sidescan systems. Transducers for multibeam sonars are generally attached to a vessel, rather than a towfish, so the area of seafloor covered by these systems depends upon the depth of the water.
Understanding Ocean Acoustics
The following information is from http://celebrating200years.noaa.gov/transformations/hydrography/
Using Lead Lines to Collect Hydrographic Data
Early hydrographic surveys involved measuring depths using a hand-held lead line with positions determined by three-point sextant fixes to mapped reference points. Lead lines were ropes, or lines, with graduated depth-markings and a lead weight attached to the end.
To obtain a sounding, a leadsman stationed in a sounding chair would heave the lead weight far enough ahead to give it time to sink to the ocean bottom just before the leadsman was over that point. A right-handed leadsman coiled in his left hand as much line as was needed to obtain a vertical cast. He grasped the line at the toggle with his right hand and swung the lead over his head in a vertical arc for one or two complete circles, to give the lead sufficient momentum. He released the lead at the bottom of one of the swings, so that it is cast ahead in the direction the vessel was moving. As the lead was thrown ahead, the leadsman would feed out the coiled line from his left hand. When the lead struck the water, it began to sink vertically. The leadsman would gather in the slack line as the vessel approached the spot where the lead hit the water. If the proper amount of line was thrown out, the lead will have sunk to the bottom just before the vessel arrived over it. The leadsman would then haul the line taut and raise the lead slightly off the bottom to straighten the line. He would lower the lead until it touched the bottom just as the sounding chair came vertically over the spot. The depth of the water was then read using the markings on the line.
Lead line soundings were usually taken from a slow-moving vessel. Soundings could only be taken in depths where the leadsman could heave the lead far enough ahead of the vessel so that the line could be vertical by the time the vessel “caught up.” This depth limit would vary considerably, depending on the skill of the leadsman and the height of the sounding chair above the water. Under average conditions, the depth limit was approximately 10 fathoms for smaller vessels, and on ships and auxiliary vessels, the limit was approximately 15 fathoms.
Side scan sonar
Side scan sonar technology is a specialized sonar system used as a tool to search for and detect submerged objects such as wrecks and obstructions on the sea floor. Side scan sonar is also used to determine the shape of the seafloor. Most side scan sonar systems, however, cannot provide any depth information.
A typical side scan sonar consists of a topside processing unit on board a vessel, an electrical/mechanical cable for data transmission and towing the side scan, and a towfish. The towfish transmits and receives narrow bands of acoustic energy (sound) that are reflected back for imaging.
Like many other sonars, a side scan sends out sound energy and analyzes the return signal (echo) that has bounced off the bottom or from other objects. With side scan sonars, the transmitted energy has a fan-shape form that sweeps the bottom from directly beneath the towfish to either side, typically to a distance of 100 meters.
The strength of the return echo is continuously recorded, creating an image or picture of the seafloor. A side scan sonar image is produced one line of data at a time. Natural or human-made submerged objects that lie on the bottom create a darker image (strong return) and shadows from these objects are light areas with little or no return.
Multibeam sonar
Most multibeam systems are hard mounted to either the bottom of a vessel's hull or on a pole or arm that is on one side of a vessel, rather than being towed though the water like a side scan sonar.
Multibeam echo sounder systems (MBES) represent the current generation of echo sounding technology that was originally developed by the U.S. Navy some 30 years ago.
MBES are primarily used today to acquire full- and partial- bottom bathymetric coverage, to determine least depths over critical items such as rocks, wrecks, obstructions, and other navigation hazards. These systems emit sound waves and then measure and record the time elapsed between the emission of the signal from the transducers to the seafloor or object and back again. MBES also have the ability to produce a "swath" of soundings (i.e., depths) to ensure full bottom coverage of a particular area.
Multibeam systems can have more than 100 transducers, which can compute accurate depths that cover a distance on either side of the ship equal to about four times the water depth. MBES obtain large amounts of data that can produce high-resolution models of the seafloor.
A unique aspect of multibeam sonar is the integration of vessel attitude into the collection of the data. This is accomplished through a Global Positioning System and data from an Inertial Motion Unit (IMU). The IMU makes very precise measurements of vessel attitude many times per second. By integrating attitude measurements with the timing of the sonar echo, an accurate bathymetric record can be produced regardless of the echo path through the water. This aspect of multibeam technology makes it the most complicated sonar system and the most expensive to operate.
Investigation 4: Searching for Sounds in the Sea
Scientists began looking at acoustic, or sound, technologies because right whales, like other marine mammals, rely on sound for survival, since it is often too dark in the ocean to see well. Hearing is the most important sensory system for whales. Whales and dolphins have three times more neurons devoted to hearing than any other animal. Hearing is important for communication, selecting mates, and avoiding predators. Sounds are also produced during feeding and to help navigate underwater.
Marine mammals use sound in two ways: passively and actively. In passive acoustics, the animal makes no sound of its own. Instead, it listens and interprets the sounds made in the environment.
Scientists have developed technologies that are also either active or passive. Some active acoustic systems have separate sources and receivers. An example is an underwater telephone. Other active acoustic systems have one animal or instrument that is both a sender and receiver. Sonar and echolocation are examples of this. The sender of the signal —a person, a machine, or a marine mammal, sends a sound that travels and bounces off an object and returns to the receiver. The return signal can give information about the object such as its size, shape, direction, and speed. Using sound in this way, both whales and people can "hear" what is in their environment.
In active acoustics an animal creates a sound. The sound is then received by a "listener" which could be another whale or technology. If you would like to do an extension in your classroom, it is much simpler to locate a ship that pings to and receives a ping from a transponder using the method of triangulation (see http://omp.gso.uri.edu/dosits/people/navigatn/1.htm) than to introduce the mathematics of calculating time-of-arrival differences.
Ocean acoustics
Research Project Description: Lisa Munger and Right whale Acoustics
National Marine Mammal Lab with reports and marine mammal images
How to build a hydrophone
Whale Acoustics Lab at Scripps Institution of Oceanography
Underwater Sounds Recorded in Glacier Bay
NOAA Vents Program Acoustic Monitoring: Spectrograms
Ocean Link – An ocean of sound
The Science of Sound
Right Whale Information:
Right whales are found worldwide but in small numbers. There are three separate species, the North Atlantic right whale (Eubalaena glacialis), the North Pacific right whale (Eubalaena japonica), and the southern right whale (Eubalaena australis) in southern oceans. North Atlantic right whales live in the North Atlantic Ocean, and North Pacific right whales live in the North Pacific Ocean.
Many large whale species are in danger of going extinct, and the northern right whales are some of the most endangered whales in the world. The North Atlantic right whale population has only 300 individuals. Scientists believe that there are fewer than 100 North Pacific right whales alive today in the waters off western Alaska. The population of right whales in the Southern Hemisphere has several thousand whales and is growing in size.
The right whale moves slowly and feeds on the surface. Commercial whaling on the right whale began in 1838, and by 1900 they were already rare. Whalers liked to hunt right whales because they were easy to capture. They have a large amount of blubber, so they floated to the surface after they were killed. Hunters could get large amounts of oil, meat, and whalebone from each whale. The hunting of right whales was banned internationally in the 1930s, but whaling continued by the Japanese and USSR, who were not included in the agreement. The harvests that continued into the 1960s likely prevented the populations from growing.
It is difficult to study North Pacific right whales near Alaska. It is hard to survey large areas to find a small number of animals. Using ships to make surveys is expensive and very restricted in terms of a complete survey. Scientists don’t know when the whales arrive in Alaska waters and when they leave. Winter surveys would be very difficult. Sea conditions are often stormy even during summer, which makes the surveys more difficult and the whales hard to spot. In addition, observations can’t be made at night.
To determine how many whales are in the population, a method was needed to distinguish individual animals (this is possible from boats). Although airplanes can be used to spot whales or groups of whales, aerial photos can’t be used to identify individual whales. Typically, information about the locations of right whales has come from historical data collected by whalers in their ship’s log and by scientists onboard ships. The whalers recorded their whale sightings and their kills along with the ship’s position every day. Mapping all of these data along with data collected by scientists has guided researchers toward concentrating their efforts into a specific area, but they still had all the problems associated with making observations of the small numbers of surviving whales in stormy seas. They needed a technology different from the visual observations made by people onboard a ship.
Right whale links
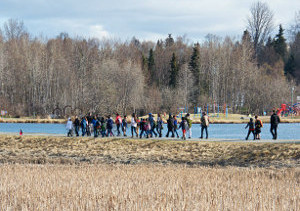
Investigation 5: Exploring Our Local Waters
Field trip options:
Many of the activities listed below will work for a stream, pond, or ocean setting. Decide which type of “exploration” best fits with the water in your area, and choose activities that will work best for the interests and abilities of the students.
Stream Exploration. This option includes a stream walk. You may also decide to gather water quality data, conduct a macroinvertebrate survey, or create a map of the area.
The Alaska Stream Team Monitoring Field Guide Specific details and procedures for activities that will help assess the health of your local stream.
The following activities are from the GLOBE Project
Freshwater Macroinvertebrates. Students discover macroinvertebrates, and identifying them.
Water Transparency. Students will measure water transparency using a transparency tube or Secchi disk.
Water Temperature.
The Global Water Sampling Project. This is a collaborative investigation with students around the world, but it only happens periodically. Check the Web site for schedules.
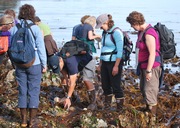
Beach Exploration. This option includes a trip to the beach.
A variety of activities can be included with the beach trip:
Sand Lab. Collect sand, investigate it closely, and contribute to an online “sandbox” of sand photos.
Beach transect. Students participate in a transect study to determine type and number of beach organisms.
Beach walk biodiversity sampling. Students record the different types of organisms, but do not keep track of the numbers of each organism.
CoastWalk Survey. Students will explore the beach and become familiar with the plants and animals there (from Center for Alaskan Coastal Studies).
Gulf of Alaska CoastWatch Activity Guide (from Center for Alaskan Coastal Studies).
Pond life
Bucket Buddies. Students around the world collect samples from local ponds to discover if organisms found in pond water are the same worldwide. This project takes place in the fall, during a scheduled period. Check the Web site for schedules.
Pond Identification Kit
Investigation 6: Discovering Underwater Wonders
Why do we still know less in some ways about the floor of the oceans than we do about the surface of the moon?
It is hard to study the ocean and its floor because:
- Even though the moon is a greater distance from the earth than the ocean bottom is from the sea's surface, we can see the moon's surface but we can't see the ocean's bottom.
- The oceans are nearly 4,000 m (on average) deep and sea water is not very transparent.
- Pressure is extremely high in the deep parts of the ocean.
- Seawater is corrosive so instruments must be kept from getting wet.
- The sea surface is dynamic, so it's hard to deploy (place or launch) instruments over the side of a ship.
- We cannot breathe in water so we can't easily swim down to the bottom.
- Water absorbs light and other electromagnetic radiation.
- We must tow sonars back and forth across the ocean to map the seafloor.
- Most important reason: There just aren't enough ships available with sonar to map the seafloor. Areas the size of Texas have never been surveyed.