Alaska Sea Grant

Teacher Resources

Teacher Resources

Sea urchins, seastar, and kelp in waters near Amchitka

NEW! Webinar for K-12 educators: “Sea Otters and People.” Overview of Alaska sea otter ecology and recent research related to human-sea otter conflicts in Kachemak Bay and Southeast Alaska. Presenters: Angela Doroff, Science Director of the Kachemak Bay Research Reserve, and Sunny Rice, Alaska Sea Grant Marine Advisory Agent, Petersburg. Teaching tips on use of the information in teaching Alaska Seas and Watershed units at various grade levels are included. 3/4/2016.

Teacher Background on Ecosystems

An ecosystem is made up of plants, animals (including humans), microbes, and physical environmental features that interact with one another. Ecosystems are dynamic and interconnected, both by the physical environment (e.g., currents transporting larvae from one part of the ecosystem to another) and by biological interactions (e.g., kelps or creating habitat or predators consuming prey).

Ecosystems come in many sizes, often with small ecosystems nesting inside of larger ones. For example, a kelp forest represents a small habitat ecosystem nested within a large ecosystem connected by the Alaska Coastal Current. Large ecosystems contain multiple habitats such as sandy beaches, rocky beaches, kelp forests, or pelagic habitat.

(The Beaufort Sea, the Eastern Bering Sea, the Chukchi Sea, and the Gulf of Alaska are recognized as Large Marine Ecosystems among 10 within the U.S. Exclusive Economic Zone.)


Teacher's Background Information on the Story

The story begins with biologist James Estes being surprised by the results of his sea otter survey of an area in the Aleutian Islands that he has been studying for 15 years. The numbers of otters he sees are far less than in previous surveys. What has happened to the missing otters is a mystery.

Dr. Estes was surprised by the obvious decline in numbers because he had previously studied the sea otters when populations were expanding. Sea otters disappeared from much of their range from the Aleutians to California as a result of the fur trade during the late 18th and the 19th centuries. Several small remnant populations remained, however, in the Aleutians. These populations reproduced rapidly and eventually recolonized all of the available habitat around the islands.

Past Studies of the Ecosystem:

In 1977, scientists Jim Estes and John Palmisano completed an ecosystem study in the Aleutian Islands that demonstrated how ecosystems change over time, and the influence that one "key" or "keystone" species can have in the overall structure of the ecosystem. They compared waters around two islands—Amchitka Island, with abundant sea otters, and Shemya Island, which the otters had not yet reached. In addition to the absence of otters, another obvious difference between the two islands was the absence of kelp beds around Shemya and their presence around Amchitka. The otters were often seen wrapped up in kelp, resting or sleeping. But what else did otters have to do with kelp beds?

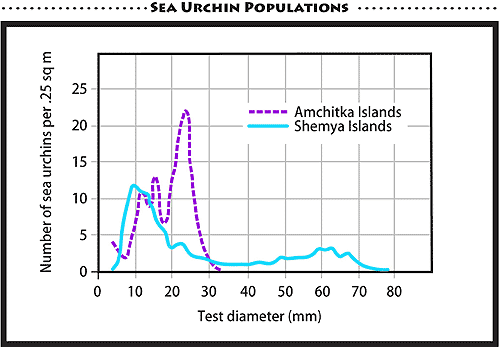
The scientists compared the sea otter population with the density and biomass of the kelp beds, and also measured the density of a variety of marine invertebrates inside the kelp bed habitat. They also set out fish traps in the kelp beds. Their data demonstrated that around Amchitka, a high density of sea otters correlated with a high density of kelp beds, low numbers of small sea urchins, and high numbers of kelp greenling, which was the most abundant fish and one that otters preyed on. Conversely, around Shemya, the absence of otters was correlated with sparse kelp beds, high numbers of large and small sea urchins, and low numbers of kelp greenling. This led to the concept of the sea otter as a keystone species whose removal greatly changed the dynamics of the ecosystem, and the roles and influence of other species. In the absence of otters, large numbers of sea urchins could graze the kelp beds and actually topple them by gnawing on their base, turning them into "urchin barrens" of low diversity. With otters present, the kelp beds flourished as the "forests" that provided food and shelter for a diversity of marine invertebrates and fish.

The study of Amchitka and Shemya was repeated in 1986-87 and again in 2000. Otters had still not reached Shemya and the correlations of otters, urchins, and kelp greenling were the same as in 1977. In 2000, Shemya and Amchitka had similar characteristic of few otters—abundant, small urchins and sparse kelp beds.

Part 1 of the Story

In 1992, Jim Estes finds low numbers of otters at Amchitka, where he has studied the otters and kelp forest ecosystem for 15 years. The otter population had been high all through the 1970s and 1980s. His report of the data to the U.S. Fish and Wildlife Service leads to more surveys in 1992 and 2000 of the entire Aleutian Islands.

Part 2

The 1977 study is described to help students understand how scientists collect data and study ecosystems in Investigation 2.

Part 3

The data about the declining sea otter populations in the Aleutian Islands trigger a major scientific effort to determine the cause of the decline and changes in the ecosystem related to requirements of the Endangered Species Act. In Investigation 3, the students review the evidence for six hypotheses, the killer whale predation hypothesis being the only likely one.

The Killer Whale Predation Hypothesis

The only way to prove this hypothesis would be to observe it happening or find a dead predator whose last meals could be determined from its stomach contents. Coincidentally, the first killer whale attack on a sea otter was observed and reported in 1991 and nine more were reported in the early1990s. Very few dead killer whales were ever found, although in 2005 the stomach of a dead killer whale in Prince William Sound had remains of four otters along with many other marine mammals, salmon, and even some rocks. But these observations were not sufficient data to reach a conclusion that killer whales were the cause of the sea otter decline. Several biologists who had studied killer whales in Alaska over long periods were skeptical, since they had never observed predation and rarely observed attacks. The estimated number of killer whales within 100 miles of the Aleutian Islands at that time was 4000. Of those, 90% were estimated to be in resident groups that stayed in fairly predictable areas and ate only fish, and the remaining 10% were individual whales that traveled widely, joined transient groups, and fed on marine mammals. The scientists reasoned that sea otters would make a very small and very furry meal for a large killer whale, and hardly worth the trouble of catching it. The University of Washington’s Jim Paine declared otters to be like "dental floss" to the large toothed whales.

A study of radio-collared otters provided an opportunity to test the hypothesis. In 1993, Jim Estes put radio collars on otters in two different groups that lived in different types of areas, and flew surveys over five years to count the number of animals in each group. One group stayed in Clam Lagoon, which had a narrow mouth and was inaccessible to killer whales. The other group ranged over Kuluk Bay, which was open and accessible to the whales. Over five years, the reproductive rates were the same—the same percentage of pups were being born and surviving—but the loss of animals from the area accessible to killer whales was much higher than in the protected lagoon. The study continued and the patterns held, but in1998 the otters left Clam Lagoon possibly to find more food.

Another type of evidence is related to the mathematical model for how killer whale predation could have reduced the sea otter population at the observed rate. Jim Estes worked with colleagues Terrie Williams and others to figure out the math. They asked: How many sea otters would an adult killer whale have to eat to get all the calories it needed in a single day? In a year? Using information on the caloric needs of captive animals for the killer whale predator needs, and using "caloric bomb" equipment, which could reduce a whole sea otter into its constituent parts and translate its chemical composition into calories that each otter prey could supply, they calculated that a group of five killer whales (four females and one male) feeding exclusively on sea otters could have been responsible for the observed loss of 40,000 sea otters over six years.

The Theory of a Trophic Cascade

A more general theory emerged from Estes and several other scientists, based on thinking about the larger oceanic ecosystem of which the killer whale, otters, and kelp bed communities were a part. Industrial whaling in the 1800s and early 1900s had killed thousands of large whales. Had they been a major target of the killer whales? Had the whalers disposed of the remains of the whales and provided the killer whales with a source as scavengers? In the absence of the whales and scavenging opportunities, had the killer whales switched to feed on smaller marine mammals like sea lions and seals? Scientists had documented a major decline in sea lions and seals in western and southwestern Alaska. Were the sea otters the next on the list as the killer whales ate their way down the food chain? If so, it would be a larger scale example of the effect of removing species from the food web and triggering a cascade of trophic effects related to who ate whom (additional information 1). Other scientists point out the lack of data to support this hypothesis and the impossibility of testing the hypothesis about relationships that happened in the past (additional information 2).

Has the mystery been solved? Status of the research in 2007

Alaska’s marine wildlife populations are often difficult to study, particularly those in more remote areas like the Aleutian Islands where the cost of research is high and extreme weather conditions are common. The "sea otter story" was chosen for this unit because of its focus on changing ecological relationships and the clear science story it provided. The data collected by scientists demonstrated clear trends.

It’s very important to distinguish between theories, testable hypotheses, and conclusions while teaching this unit. In the case of sea otter declines, if killer whale predation is considered the answer to the mystery, other factors that may have contributed to declines in several marine mammal populations in southwestern and western Alaska might no longer be considered or addressed. Other factors to consider could include changes in ocean conditions related to climate change or overfishing. The mathematical calculations about the number of killer whales that could have been responsible for the observed decline paint a plausible scenario, but they do not prove that this actually occurred. Killer whale predation is instead considered a theory based on a "weight of evidence" approach. Scientists and wildlife managers are continuing to study other factors that may also be responsible and important to understand in order to devise ways to avoid contributing to further declines or to help the sea otter populations recover (additional information 3).

What about Other Areas of Alaska and Other Places in the Range of Sea Otters?

Following survey efforts, the sea otter decline first detected in the Aleutians has been determined to be widespread through the entire Aleutian Islands chain and the waters of the Alaska Peninsula and Kodiak. This southwestern population was declared a Threatened Species in 2005. In 2005, the U.S. Fish and Wildlife Service trained volunteers in Kachemak Bay to report all dead sea otters found washed up on beaches and to send carcasses or skulls to them for study. So many were found that an "unusual mortality event" was declared in 2006. The major causes of death have been disease and boat strikes (DeVaughn 2006).

Sea otter populations are stable or increasing in other areas of Alaska. Although sea otters prefer to eat sea urchins when they are available, they eat a wide variety of other animals, including chitons, mussels, clams, crabs, fish, and octopus. Their habitat is not limited to kelp beds. The sea otter-kelp-urchin relationship was first studied and documented in California as well as the Aleutians. The large kelps that form the "forest" habitat require rocky bottoms for attachment of their holdfasts. Sea otters are also found in large numbers in areas with "soft" bottoms that are a combination of mud, sand, and smaller rocks. Here, they feed primarily on clams and mussels.

No otters were present east of Prince William Sound or in Southeast Alaska in the early 1900s until they were reintroduced in Southeast Alaska. Scientists have been studying their expansion into Glacier Bay and are finding similar relationships among the otters, kelp stands, and urchins along with use of other habitats and a variety of food sources.

The sea otter was one of the many species harmed by the Exxon Valdez oil spill in 1989. Nearly 1000 otters were found dead in the immediate aftermath of the spill, and scientists estimate that as many as 3900 died. An otter's fur, when oiled, loses its insulating properties; most perished from hypothermia or oil toxicity. Rehabilitation was a difficult process that involved capture, cleaning, and a period of recovery in captivity. Although 300 oiled otters were caught shortly after the spill and were taken for rehabilitation, and 200 were released into the wild, their survival was low. In 2007, sea otters remained on the list of species that had not recovered from the oil spill. Urchin populations did not eliminate the kelp stands in Prince William Sound following the reduction in otter numbers.

Sea otters had also disappeared from California after the fur trade, but were reintroduced by animals transplanted from Alaska populations. They have recently been declining. The major cause of death that has been documented is a disease that is spread from cats through the dumping of cat litter that finds its way into the marine ecosystem.

Killer whale predation as the cause of the sea otter decline, and the trophic cascade in the ocean ecosystem remain theories. Because they depend on finding evidence of events that occurred in the past, those theories will likely never be proved or disproved. In the case of the Southwest Alaska sea otter population, which was declared Threatened under the Endangered Species Act in 1972, scientists are continuing to look for evidence of other causes of the decline that can be addressed to aid in the recovery of the sea otter populations. Killer whale predation remains the best hypothesis.

Scientists predicted that declining otter numbers would result in a shift from thriving kelp beds to urchin barrens. In 2000, another study of kelp beds, urchins, and kelp greenling was conducted at four islands. The conclusion of the study stated: "The abundances of urchins, kelp and greenling were unchanged at islands where otters were initially rare but had shifted to the characteristic pattern of otter-free systems at islands where otters were initially abundant."


Additional Information 1:

The theory about an ecosystem trophic cascade initiated by industrial-scale whaling in the 1900s was published in the scientific literature in1998. James Estes and several other biologists published a paper (Williams et al. 2004) that set out the hypothesis that an ecological chain reaction dating to industrial-scale hunting of whales in the North Pacific has driven the widespread decline of Alaska seals, sea lions and otters that had puzzled scientists for decades. The killing of whales caused a collapse in the food chain. As a half-million whales were wiped out by Japanese and Russian whaling fleets after World War II, killer whales that once preyed on the larger "great" whales had to look for other food to eat. So, the scientists theorized, some of the killer whales turned to seals instead. But before whaling, seals were never as numerous as whales. And it takes lots of seals to equal the calories in a single great whale. It wasn't long before most of the seals were eaten and the killer whales—also known as orcas—turned their attention to Steller sea lions. Then, when those grew rare enough, they went after otters. "If our hypothesis is correct, either wholly or in significant part, commercial whaling in the North Pacific Ocean set off one of the longest and most complex ecological chain reactions ever described," says the paper being published online in the Proceedings of the National Academy of Sciences (McClure 2003).

Additional Information 2:

The historical trophic cascade theory has been subject to debate among marine mammal biologists. Marine mammal researchers Craig Matkin and Doug DeMaster have pointed out that there is no evidence that killer whales ate the large whales historically and then switched to sea otters. They point out the small amount of nutrition, and large amount of hair, that a single sea otter meal would provide a killer whale. DeMaster also points out that rarely is one factor responsible. As described in the 2002 U.S. Fish and Wildlife Service report, the evidence of recent killer whale predation on otters is based on a small number of dead killer whales and sea otters found on land and a small number of observations of attacks. Craig Matkin, in his many hours observing killer whales, has seen attacks, but never the consumption of the otter by the whale. His recent study (2005-2006) of humpback whale migration through Unimak Pass in the Aleutians, however, provides evidence that transient killer whales concentrate there in large numbers and are likely targeting the large whales as prey. (web refs) (web ref - NPR interview)

Additional information 3:

In April 2002, the U.S. Fish and Wildlife convened a panel of expert scientists to review all of the existing scientific information. The report of that meeting said that "although there are questions about the overall magnitude and geographic extent of the decline, the trend is clear: the sea otter population has undergone a dramatic population decline throughout most of southwest Alaska in the past 10-15 years. Within this area, the most intensively studied region is also the most remote. Research during the 1990s at several islands in the western and central Aleutian Islands indicated that the decline is the result of increased adult mortality. There was no evidence that starvation, disease, contaminants, human harvest, or commercial fishing activities were responsible for the decline. A significant increase in observed attacks by killer whales, a stable sea otter population in the protected waters of Clam Lagoon on Adak Island, and relatively few beach-cast carcasses suggested that predation by killer whales may be the cause of the decline in the Aleutian Islands."

Another summary statement from the report:

It is likely that we will never be able to identify the cause of the current sea otter decline with certainty. The current theory of killer whale predation is based on a "weight of evidence" approach. Evidence that supports this theory includes:

  1. A significant increase in the rate of observed killer whale attacks on sea otters;
  2. Stable sea otter numbers in a protected area (Clam Lagoon on Adak) as compared to exposed areas; and
  3. Lack of evidence for other causes (body condition, food availability, scarcity of carcasses) (U.S. Fish and Wildlife Service 2003).

References

DeVaughn, M. 2006. Why are the sea otters dying at Kachemak Bay? Anchorage Daily News, Anchorage, Alaska, September 27, 2006.

McClure, R. 2003. Researchers say whaling altered the food chain. Seattle Post-Intelligencer, Seattle, Washington, September 25, 2003.

U.S. Fish and Wildlife Service. 2003. Southwest Alaska sea otter decline workshop: Summary report. U.S. Fish and Wildlife Service, Anchorage, Alaska. 17 pp.

Williams, T.M., J.A. Estes, D.F. Doak, and A.M. Springer. 2004. Killer appetites: Assessing the role of predators in ecological communities. Ecology 85(12):3373-3383.

Please Note: Scientists have done additional research in marine ecosystems in addition to the one surrounding the Aleutian Islands where sea otters were also extirpated and subsequently re-introduced or recovered from small, remnant populations. The Alaska Seas and Watersheds 5th grade unit "bidarki story" provides a different story about the interactions of people, sea otters, and other predators. For additional teacher background, view the webinar:       The Case of the Missing Sea Otter  2016 update to the science behind the Grade 4 unit (Produced by Alaska Sea Grant)


Data from Study:

Type of Data or Observation (Intertidal Zone)

Rat Islands (Amchitka)

Near Islands (Shemya)

Sea Otter Presence/Absence

Abundant (10-30/km2 of habitat)

Scarce or absent

Kelp Presence/Absence

Complete mat of kelp

Kelp sparse or absent

Average Intensity of Grazing

<1% of kelp plots grazed

50-75% of kelp plots grazed

Average Urchin Density (per m2.)

8

78

Urchin Size (Length)

<12 mm

Maximum of 21 mm

(Adapted from Estes and Palmisano 1974.)

Sea Otters Facts Known before Study Began

  1. One of only 11 remnant populations of sea otters in the world after 1900 was located in the Rat Islands. From the 100 animals that were estimated around Amchitka in 1911, the population had grown rapidly and expanded into all of the islands in the group. There had been a high density of sea otters in the Rat Islands for about 20-30 years and the numbers had been increasing.
  2. After the sea otters had disappeared, the first observations of otters in the Near Islands was in the 1950s. At the time they arrived in Attu in the 1970s, and in Shemya in the late 1980s or early 1990s, only a few sea otters had been seen anywhere in the Near Islands and no group of otters had become established around any of the Near Islands.
  3. Studies of kelp beds in other areas had shown that they provided food and cover for a variety of marine invertebrates and fish.

Hypothesis of Scientists Jim Estes and John Palmisano:

A dense population of sea otters reduces the sea urchins to a sparse population of small individuals. The result is a release from grazing pressure of the urchins on kelp and a significant increase in the size of kelp beds and the marine animals associated with them.

Difficulties of getting exact counts or measurements:

Sea Otters

  • They dive under water to feed.
  • The Aleutian Islands are remote and subject to very bad weather.
  • Plane surveys are expensive, small boat surveys can only be done safely in some areas, and numbers are hard to compare.
  • People have different abilities to see and count all of the otters.

Sea Urchins

  • Urchins live on the bottom. They are underwater much of the time even when they are in the intertidal zone and always underwater in the subtidal zone. The only way to count them is with diving gear.
  • Visibility is often not very good underwater.
  • It is difficult to get a count of a very dense group of urchins in a small area.
  • It is impossible to count all of the urchins over a large area.

Kelp Beds

  • At the time they did the study, they didn’t have the type of cameras and remote sensing technology that would allow them to take aerial photos from which they could measure the area of kelp beds in specific areas.
  • Diving was required.
  • The differences in the amount of kelp in the two areas were so great that they didn’t really need to determine if the two areas were different and by how much. They really wanted to know the effect of different densities of urchins on the kelp.

Methods Used by the Scientists:

Sea otter counts are done by airplane, by boat, and from land on islands that have road systems. Comparing the data and correcting for “sightability” is difficult. Studies have been done to develop correction factors, based on studies with marked animals locatable by radio-tracking. The percentage of animals that can be observed after being tracked to a general location can provide the correction factor. Because of these difficulties, the sea otter “counts” are estimates, not censuses, but the declining trend is clear even though the actual number of animals that were in the population and how many there are now cannot be determined.

For the urchin counts and kelp measurements:

25-40 sites were randomly located at each island.

20 randomly located 0.25 m2 quadrats were placed on the seafloor at each site.

Within each quadrat, divers:

  • Counted individual kelp plants (anchored to the bottom) and identified them to species.
  • Counted the number of urchins and measured their test (shell).

To measure grazing pressure:

Grazing experiments were conducted by anchoring the same biomass of kelp at different locations, placing one-half in cages that excluded animals that would graze on the kelp. After a set amount of time, the remaining biomass of the grazed kelp was weighed for comparison with the ungrazed kelp.

¼ m2 quadrats were used, so results were averaged and multiplied by 4 to express the data as number per m2.

Results

Type of Data or Observation
(Intertidal Zone)

Rat Islands
(Amchitka)

Near Islands
(Shemya)

Sea Otter Presence/Absence

Abundant (10-30/km2 of habitat)

Scarce or absent

Kelp Presence/Absence

Complete mat of kelp

Kelp sparse or absent

Average Intensity of Grazing

<1% of kelp plots grazed

50-75% of kelp plots grazed

Average Urchin Density (per m2.)

8

78

Urchin Size (Length in Inches)

<12 mm

Maximum of 21 mm

(Adapted from Estes and Palmisano. 1974.)

Conclusions:

1. The differences between the two benthic (bottom) communities on the Near and Rat islands are probably related to the presence or absence of sea otters.

2. The otters control the sea urchin populations, and the absence of grazing pressure allows the kelp beds to flourish.

3. Reducing the population of sea otters makes it possible for sea urchin populations to increase, and this leads to a significant reduction in the size of kelp beds and associated animals.

Evaluation:

James Estes and his colleagues did repeat the study in 1986-87 (when otters had reached the Near Islands and were thought to be at maximum density), and during the 1997-2000 period. In the ten-year period between 1987 and 1997, they found that sea urchin size and density increased to produce 8 times the amount of biomass, while kelp density decreased to one-twelfth. The percentage of kelp grazed increased from 1.1% per day in 1991 to 47.5% in 1997—all indicative of an “urchin barrens” in the absence of a high density of otters.

The data they collected at Amchitka in 1997 were similar to those for Adak (high urchin numbers, small urchin size, sparse kelp beds, high grazing rates on kelp).

Sample Data Table:

1990s Observations

Type of Data or Observation
(Intertidal Zone)

Rat Islands
(Amchitka)

Near Islands
(Shemya)

Sea Otters


Few

(Teacher fills in)

Few

(Teacher fills in)

Kelp


(Student Prediction)

"little" or "not much"

(Student Prediction)

"little" or "not much"

Urchins

(Student Prediction)

"lots" or "many"

(Student Prediction)

"lots" or "many"


Photo Quadrats

Use enlarged photos of a section of beach, or any photos or posters you can find that show large numbers of animals. For example, you might use a poster showing a caribou herd or a picture from a bird rookery. Using the Quadrat Data Sheet and the slide holder quadrats from the "e" activity, have students work in groups of four to practice counting organisms in the quadrat and recording data. Have students practice looking for the area where their organism seems most dense, and counting and randomly tossing their quadrat and counting organisms.

Discuss the protocols for counting organisms that are only partway in the quadrat. Tally your findings and try to identify your organisms. If time allows, practice using various photographs or beach sections.

This activity will help students to learn and review proper field etiquette. Students will be properly prepared for both the field trip experience and the ways in which their presence and activities in the field could impact the habitat they are trying to study.

You Will Need:

What to Do:

Introductions:

Prepare students for their field trip by discussing possible impacts their presence at the beach might have and ways in which they can help to minimize the impact and prepare themselves for a successful trip.

Procedures:

Have students come up, one at a time, and pull an item out of the grab bag. Ask the student to try to think of a way that their item symbolizes a field etiquette "rule" that should be followed or action they should take at the field site.

Once all of the items have been pulled from the bag, distribute the Field Etiquette Handout and discuss any other items that are useful to your group

Field Etiquette Grab Bag Contents

Boot:

Walk single file over areas of attached plants and animals. Walk, don’t run and watch your step!

Hat:

Dress warmly!

Snail Shell:

If you find an animal tightly attached, leave it attached! Don't collect shells and other “stuff" because they can be a home to other animals.

Litter:

Don't litter, in fact—let's pick up trash!

Plastic Toy Crab:

Hold animals close to the ground—they may be slippery, slimy, or quick. Use small tubs and buckets if possible to view animals. Cup hands and keep them moist with a little bit of water if you are holding animals.

Toy Shovel:

Fill in holes! Small animals left underneath a big pile of mud and sand can be killed and someone could fall in the hole and get hurt.

Rock: (covered with barnacles on one side if relevant)

Return rocks to original position. Turn rocks over gently. Don't turn over really large rocks or you might crush the animals that live below!

A quadrat is a frame used by marine biologists to perform counts of the density of organisms or the percentage of cover in a standard area. You may use quadrats made with 4 meter sticks for an area of one square meter, or you may use quadrats that are smaller. Hula hoops also work as quadrats if you have access to those. A scientist always knows the area of his or her quadrat, since it is used for sampling and making estimates of what will be found in a bigger area.

To make a ¼ square meter quadrat, use pvc tubing and elbow joints. Cut tubing so that the inside dimensions of your square measure 25 cm x 25 cm. You will need one quadrat for each group of sampling students.

Statewide Data Sharing

Share the investigation of your local ecosystem with students statewide via the Alaska Seas and Watersheds Website Forum. Take a picture of something important at your field site and post it, along with a description. Be sure to include the time and date that it was taken and the weather that day.

You can also share the data and conclusions from your ecosystem investigation at the site, and post questions that your class has generated.

Investigate the Web site to see the ecosystem discoveries that students have made in other parts of the state. How are their ecosystems different from yours?

A School-Wide Celebration of our Aquatic Ecosystem

Present your learning to other students in the school and to the community by organizing a school-wide celebration. Include a scientific poster session that teaches people about the sea otter’s ecosystem and about your local ecosystem. Make a mural, make costumes, have an art show, put on a dramatic production, have a feast, sing songs about the aquatic environment. Use your imagination to help your whole school learn and celebrate.

An Aquatic Eco-Mystery: The Case of the Missing Sea Otters

Student Handouts

Items for Group Display

Material Items

Facility/Equipment Requirements

Investigation 1

Sea Otter Story Part 1

Readings 1, 2, 3, and 4

Food Chain Cards Image

Science notebooks

Map of Aleutians

Sea Otter Data Graphs

Large Diagram of Beach Image

Food Chain Diagram Image

Butcher paper

Tagboard and felt-tip pens (if clue cards are used)

Art materials for making murals, if time permits

Internet access

LCD projector OR

Student computers and overhead projector

Investigation 2

Sea Otter Story Part 2.

Sampling the “e’s” Organism Data Sheet Image

Quadrat Data Sheet Image

Data Table Image

Newspaper(s) with 1 page per student

Quadrats (small), empty color slide frames OR similar cardboard squares, 1 per student

Calculators (optional)

Stopwatch

Whistle

Quadrats (large) made from meter sticks, hula hoops, or PVC pipes (optional)

For alternate activity if playground space not available:

Large photos or posters showing animal populations on beach or elsewhere, 1 per student group

LCD or overhead projector

Internet access

Playground or other outdoor area divided into two sections

Investigation 3

Sea Otter Story Part 3

DatasheetImage

Pictures of Kelp Forest (photo 1, photo 2)

Graph of Otter Populations Image

Pictures of Urchin Barrens  (photo 1, photo 2)

Food Chain Diagrams Image (diagram 1, diagram 2)

1 “Ziploc” bag per student

Masking tape

Sashes or signs: green, blue, red (1 per student)

Popcorn

LCD or overhead projector

Large indoor or outdoor playing area

Investigation 4

Field Etiquette Handout

None

Bag or box

Grab bag items: boot, hat, piece of litter, shell, rock, toy shovel, plastic toy crab or substitute

How to Make a Quadrat

Quadrat Data Sheet

Rulers

Measuring tape

Hand lenses

Aquatic field site—beach, riverbank, or pond

Unit 4 of the Alaska Seas and Watersheds Curriculum, An Aquatic Eco-Mystery: The Case of the Missing Otters addresses the following GLEs for grades 3, 4 and 5:

Science | Reading | Writing | Math

Science

Science: GLEs for Grade 4

Investigation

1

2

3

4

The student develops an understanding of the processes of science by:
[4] SA1.2 observing, measuring and collecting data from explorations and using this information to classify, predict, and communicate.


x

x

x

The student will demonstrate an understanding of the attitudes and approaches to scientific inquiry by:
[4] SA2.1 supporting their ideas with observations and peer review. (L)*


x

The student demonstrates an understanding that interactions with the environment provide an opportunity for understanding scientific concepts by: [4] SA3.1 identifying the local limiting factors (e.g., weather, human influence, species interactions) that determine which plants and animals survive. (L)*


x

x

The student demonstrates an understanding of the structure, function, behavior, development, life cycles, and diversity of living organisms by:
[4] SC2.2 describing the basic characteristics and requirements of living things.

x


The student demonstrates an understanding that all organisms are linked to each other and their physical environments through the transfer and transformation of matter and energy by:
[4] SC3.1 identifying examples of living and non-living things and the relationship between them (e.g., living things need water, herbivores need plants).

x


x

The student demonstrates an understanding that all organisms are linked to each other and their physical environments through the transfer and transformation of matter and energy by:
[4] SC3.2 Identifying a simple food chain and diagramming how energy flows through it and describing the effects of removing one link.

x


x


The student demonstrates an understanding that solving problems involves different ways of thinking, perspectives, and curiosity by:
[4] SE2.1 identifying the function of a variety of tools (e.g., spear, hammer, hand lens, kayak, computer).


x


The student demonstrates an understanding that solving problems involves different ways of thinking, perspectives, and curiosity by:
[4] SE2.2 identifying multiple explanations (e.g., oral traditions, folklore, scientific theory) of everyday events (e.g., weather, seasonal changes). (L)*


x


The student demonstrates an understanding of the bases of the advancement of scientific knowledge by:
[4] SG2.1 recognizing the need for repeated measurements.


x


Science: GLEs for Grade 5

Investigation

1

2

3

4

The student demonstrates an understanding of the processes of science by:
[5] SA1.1 asking questions, predicting, observing, describing, measuring, classifying, making generalizations, inferring, and communicating.


x

x

x

The student demonstrates an understanding of the processes of science by:
[5] SA1.2 using quantitative and qualitative observations to create their own inferences and predictions.


x

x

x

The student demonstrates an understanding of the attitudes and approaches to scientific inquiry by:
[5] SA2.1 supporting their statements with facts from a variety of resources and by identifying their sources. (L)*


x

The student demonstrates an understanding that interactions with the environment provide an opportunity for understanding scientific concepts by:
[5] SA3.1 identifying the limiting factors (e.g., weather, human influence, species interactions) that determine which plants and/or animals survive.

x


x

x

The student demonstrates an understanding that all organisms are linked to each other and their physical environments through the transfer and transformation of matter and energy by:
[5] SC3.1 diagramming how matter and energy are transferred within and between living and nonliving things.

x


The student demonstrates an understanding that all organisms are linked to each other and their physical environments through the transfer and transformation of matter and energy by: [5] SC3.2 organizing a simple food chain of familiar plants and animals that traces the source of the energy back to sunlight.

x


The student demonstrates an understanding of how to integrate scientific knowledge and technology to address problems by:
[5] SE1.1 identifying a community problem or issue and describing the information needed to develop a scientific solution. (L)*


x


The student demonstrates an understanding that solving problems involves different ways of thinking, perspectives, and curiosity by:
[5] SE2.1 investigating a problem or project over a specified period of time and identifying the tools and processes used in that project. (L)*


x


The student demonstrates an understanding of the bases of the advancement of scientific knowledge by:
[5] SG2.1 reviewing and recording results of investigations into the natural world.


x

x

The student demonstrates an understanding that advancements in science depend on curiosity, creativity, imagination, and a broad knowledge base by:
[5] SG4.1 investigating that scientists’ curiosity led to advancements in science. (L)*


x


Science: GLEs for Grade 3

Investigation

1

2

3

4

The student develops or demonstrates an understanding of the processes of science by:
[3] SA1.1 asking questions, predicting, observing, describing, measuring, classifying, making generalizations, inferring, and communicating.


x

x

x

The student develops or demonstrates an understanding of the processes of science by:
[3] SA1.2 observing and describing their world to answer simple questions.


x

x

x

The student develops or demonstrates an understanding of the attitudes and approaches to scientific inquiry by:
[3] SA2.1 answering, “how do you know?” questions with reasonable answers.


x

x


The student demonstrates an understanding that interactions with the environment provide an opportunity for understanding scientific concepts by:
[3] SA3.1 observing local conditions that determine which plants and/or animals survive. (L)*

x


x

The student demonstrates an understanding that all organisms are linked to each other and their physical environments through the transfer and transformation of matter and energy by:
[3] SC3.1 identifying and sorting examples of living and nonliving things in the local environment. (L)*

x


x

x

The student demonstrates an understanding that all organisms are linked to each other and their physical environments through the transfer and transformation of matter and energy by:
[3] SC3.2 organizing a simple food chain of familiar plants and animals. (L)*

x


x

x

The student demonstrates an understanding of the bases of the advancement of scientific knowledge by:
[3] SG2.1 comparing the results of multiple observations of a single local event. (L)*


x


x

The student demonstrates an understanding that advancements in science depend on curiosity, creativity, imagination, and a broad knowledge base by:
[3] SG4.1 asking questions about the natural world.


x

x

x

Reading

Reading: Grade 4 GLEs

Investigation

1

2

3

4

5

[4] 2.2.3. The student comprehends literal or inferred meaning from text by making simple inferences(e.g., predicts logical outcomes,deduces missing information, suchas where a story takes place, if not directly stated)

x

x

x


[4] 2.2.4 The student comprehends literal or inferred meaning from text by drawing conclusions based on information presented in the text (e.g., cause and effect, character motivation)*

x

x

x


[4] 2.3.1 The student reads text aloud by reading orally with rhythm, flow, and expression showing understanding of punctuation and other conventions of print* (L)

x

x

x


[4] 2.5.2 The student demonstrates an understanding of main idea by locating information in narrative and informational text to answer questions related to main ideas or key details


x


Reading: Grade 5 GLEs

Investigation

1

2

3

4

5

[5] 2.2.3 The student comprehends literal or inferred meaning from text by making inferences (e.g., predicts logical outcomes, such as how would the story have been different if ____, deduces missing outcome or information, such as where a story takes place, if not directly stated)

x

x

x


[5] 2.2.4 The student comprehends literal or inferred meaning from text by drawing conclusions based on information presented explicitly in the text (e.g., cause and effect, character motivation)*

x

x

x


[5] 2.3.1 The student reads text aloud by reading orally with rhythm, flow, and expression showing understanding of punctuation and other conventions of print* (L)

x

x

x


5] 2.5.2 The student demonstrates an understanding of main idea by locating information in narrative and informational text to answer questions related to main ideas or key details*


x


Reading: Grade 3 GLEs

Investigation

1

2

3

4

5

[3] 1.2.3. The student comprehends literal or inferred meaning from text by Making simple inferences (e.g., predicts logical outcomes)

x

x

x


[3] 1.2.4 The student comprehends literal or inferred meaning from text by drawing conclusions based on information presented in the text (e.g., cause and effect, character motivation)*

x

x

x


[3] 1.3.1 The student reads text aloud by reading orally with rhythm, flow, and expression showing understanding of punctuation and other conventions of print (L)

x

x

x


[3] 1.10.2 The student connects themes by locating details in text to illustrate relevant connections to personal experience, experience of others, or other texts


Writing

Writing: Grade 4 GLEs

Investigation

1

2

3

4

5

[4] 2.2.2 The student writes for a variety of purposes and audiences by writing in a variety of nonfiction forms using appropriate information and structure (i.e., personal letters, recounts, descriptions or observations)

x

x

x


Writing: Grade 5 GLEs

Investigation

1

2

3

4

5

[5] 2.2.2 The student writes for a variety of purposes and audiences by writing in a variety of nonfiction forms using appropriate information and structure (i.e., step by- step directions, descriptions, observations, or report writing)

x

x

x


Writing: Grade 3 GLEs

Investigation

1

2

3

4

5

[3] 1.2.1 The student writes for a variety of purposes and audiences by choosing the appropriate organizational structure to match a purpose and audience (e.g., letters and notes, recounts, stories, and poems) (L)

x

x

x


Math

Math: Grade 4 GLEs

Investigation

1

2

3

4

5

[4] S&P-1 The student demonstrates an ability to classify and organize data by [designing an investigation and collecting L], organizing or displaying, using appropriate scale, data in real-world problems, using bar graphs, tables, charts, or diagrams with whole numbers up to 25


x

x

x


4] S&P-2 The student demonstrates an ability to classify and organize data by using information from a variety of displays (tables, bar graphs, or Venn diagrams)

x


x


[4] N-1 The student demonstrates conceptual understanding of whole numbers to ten thousands by reading, writing, ordering, or [counting L]


x


x


[4] E&C-4 The student accurately solves problems (including real-world situations) by multiplying two-digit numbers by single-digit numbers


x


Math: Grade 5 GLEs

Investigation

1

2

3

4

5

[5] S&P-1 The student demonstrates an ability to classify and organize data by [designing an investigation and collecting L], organizing, or displaying, using appropriate scale, data in real-world problems, using bar graphs, tables, charts, diagrams, or line graphs with whole numbers up to 50


x

x

x


[5] S&P-2 The student demonstrates an ability to analyze data (comparing, explaining, interpreting, evaluating; drawing or justifying conclusions) by

x


x


[5] N-1 The student demonstrates conceptual understanding of whole numbers to millions by reading, writing, ordering, or [counting L]


x


x


5] E&C-4 The student accurately solves problems (including real-world situations) by multiplying two-digit whole numbers by two-digit numbers or dividing three-digit whole numbers by single-digit numbers


x


[5] G-6 The student solves problems (including real-world situations) using perimeter or area by estimating or determining area or perimeter of rectangles using a key, ruler, or given measures


(x)


[5] PS-1 The student demonstrates an ability to problem solve by selecting and applying an appropriate strategy (e.g., tables, charts, lists, or graphs; guess and check; extended patterns; making a model) to solve a variety of problems and verify the results (M7.2.2)


x


5] PS-2 The student demonstrates an ability to problem solve by explaining and verifying results of an original problem and applying what was learned to new situations (M7.2.3)


x


Math: Grade 3 GLEs

Investigation

1

2

3

4

5

[3] S&P-1 The student demonstrates an ability to classify and organize data by [designing an investigation and collecting, recording L], organizing, displaying, or explaining the classification of data in real-world problems using bar graphs, and [Venn diagrams L]


x

x

x


[3] S&P-2 The student demonstrates an ability to analyze data (comparing, explaining, interpreting, or justifying conclusions) by using information from a variety of displays (tallies, tables, pictographs, bar graphs, or [Venn diagrams L]

x


x


[3] N-1 The student demonstrates conceptual understanding of whole numbers to one thousand by reading, writing, ordering, or [counting L] (M1.1.1)


x


x


[3] N-3 The student demonstrates conceptual understanding of whole numbers to one thousand by using appropriate representations of ordinal or cardinal numbers (M1.1.4)


x


x


(L) Some GLEs have been identified as Local. They are for local assessments and will not be on a state assessment.
* PSGLEs repeated with no changes across grade levels are marked with asterisks.

An Aquatic Eco-Mystery: The Case of the Missing Otters

1. Shows understanding that an ecosystem is complex and includes both living and nonliving things.
The ecosystem shown or described includes:
4 points Water, physical elements such as rocks, the sun, producers, and consumers.   
3 points
Water, physical elements, at least one producer and one consumer. 
2 points
Water OR physical elements, producer(s) OR consumer(s). 
1 point
Living things only.    
   
2. Shows understanding of interconnections and interdependence in an aquatic ecosystem.  
The interactions shown or described include:
4 points A food web (more complex than a simple food chain), shelter, adaptations of animals, effects of change.  
3 points
A food chain including producers and consumers, with at least 4 organisms, shelter. 
2 points
A simple food chain with consumer(s) and producer(s).
1 point
One simple interaction between two organisms.
   
3. Shows understanding of change in an ecosystem.
Description includes:
4 points Selection of an important element, with at least 5 reasonably possible consequences to other elements of the ecosystem.
3 points
At least 3 consequences that are reasonably possible, with little evidence of misunderstanding.  
2 points
At least 2 reasonable consequences, but also includes some incorrect or unreasonable assumptions.    
1 point
One correct consequence of removing something from the ecosystem.  
   
4. Demonstrates understanding of scientific processes.  
Describes:
4 points Questioning, Observation, and Data Collection with detailed methods and with reasons given for the importance of following scientific procedures.  
3 points
Questioning, Observation, and Data Collection.   
2 points
Two processes from Questioning, Observation, Data Collection. 
1 point
Questioning, Observing, OR Data Collection. 

4 points indicates complete understanding or an “A” grade.
3 points indicates partial understanding or a “B” Grade.
2 points indicates developing understanding or a “C” grade.
1 point indicates minimal understanding or a “D” grade.

Teachers may want to add additional criteria to the scoring guide to evaluate science notebooks, field etiquette, participation, neatness of work, writing conventions, or other desired outcomes.

Pre-assessment:

Identify a nearby aquatic ecosystem with which your students are familiar. It may be a tide pool if you live on the coast, or it could be a pond or a river. Ask students to draw a picture of the ecosystem in their science notebooks (link to web page 2), showing all of the living and nonliving things that they know about. Ask them also to label their drawing or to write what they know about how these things interact with each other. Don’t help students by giving them information as they work, since the pre-assessment is intended to measure what they already know.

Post-assessment:

Ask students to draw and label an aquatic ecosystem in their science notebooks again. You may choose to have them draw either a local aquatic ecosystem that they have had an opportunity to study, or the sea otter ecosystem that they studied during the unit. Ask them to write a paragraph about each of the following:

  1. Explain all of the interactions between things in your drawing that you know about. You may use captions and labels on the drawing instead of a paragraph, or you may use both.
  2. Choose one thing in your drawing and imagine it has been removed. What did you choose? Explain what would happen to the rest of the ecosystem if that thing disappeared.
  3. How do scientists learn about aquatic ecosystems?


Use the scoring guide to set expectations, provide feedback to students, and assign grades.

Investigation 1

DeMaster DP, Trites AW, Clapham P, Mizroch S, Wade P, Small RJ, Hoef JV (2006)
    The sequential megafaunal collapse hypothesis: Testing with existing data. Prog Oceanogr 68:329-342

Springer AM, Estes JA, Van Vliet GB, Williams TM, Doak DF, Danner EM, Forney KA,     
    Pfister B (2003) Sequential megafaunal collapse in the North Pacific Ocean: An ongoing legacy of industrial    whaling? Proc Natl Acad Sci U S A 100:12223-12228

Marine Invertebrate Identification Guides

Center for Alaskan Coastal Studies. 1999. Who's Who in the Intertidal Zone? An Atlas for Peterson Bay Field Station.

Kozloff, Eugene. 2003. Seashore Life of the Northern Pacific Coast. University of Washington Press.

Ricketts, E.F., J. Calvin, and J.W. Hedgpeth. 1985. Between Pacific Tides. Revised by D.W. Phillips. Fifth Edition. Stanford University Press, Stanford, California. 652 pp.

Curricula and Teaching Guides

Krasny, Marianne E. 2003. Invasion Ecology: Teacher's Guide. National Science Teachers Association.

Snively, Gloria. Beach Explorations: A Curriculum for Grades 5-10. 1998. Oregon and Washington Sea Grant Programs.

Videos

Alaska Sea Grant and CACS. 2004. Life on the Beach: Among Friends and Anemones. Intertidal ecology and beach etiquette. 20 min.

PBS. The Shape of Life . Eight-part series, each focused on a different marine invertebrate phylum and body plan. Available as two-DVD set.

Web Sites

Events and Announcements

Get Your Feet Wet

April 1 - May 31

Celebrate and share your local event with other Alaskan teachers and students! We'll send you and your students a certificate of accomplishment and place them on the Alaska Sea Grant honor roll if they complete a clean-up or other type of stewardship project. xx

Register here

Alaska Seas and Watersheds teaching resources and activity ideas for field trips and stewardship projects are available for all grade levels along with new NGSS-aligned lesson plans and units for field trips and the use of drones and submersibles to collect environmental data.

Coming Soon!

A collection of teaching resources for the Northern Gulf of Alaska Long-Term Ecological Research Project area and a link to resources for teaching about ocean acidification.

Professional Development

Alaska Sea Grant provides professional development in a variety of formats. Onsite in-service presentations and workshops are provided free-of-charge as an opportunity for Alaska K-8 teachers and informal educators to learn about our award-winning, Alaska-relevant curriculum materials and other educational resources.  Graduate-level courses can also be provided for the cost of Continuing Education Credits through the University of Alaska.

More information

Professional development
Tidepooling

Grants to Alaska Schools

Since its beginnings during the 2014–2015 school year, the Alaska Sea Grant school grant program has provided more than $100,000 to 10 Alaska school districts to increase local marine and aquatic education in 22 communities. The three-year, $10,000 grants have supported science curriculum revisions, development of NGSS-aligned lesson plans and units, field trip transportation, and the purchase of equipment and supplies.

If you are an Alaska teacher or administrator, contact us to get on the email list for the next announcement for a Request for Proposals.

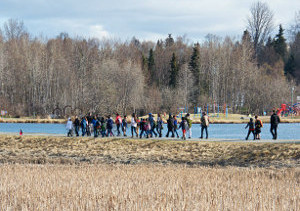
anchoragewetlandsStudents explore and collect data in Westchester Lagoon, the outlet to Chester Creek. Alaska Sea Grant funds support a watershed education field trip program for more than 250 Anchorage School District students.
 
Alaska Sea Grant University of Alaska Fairbanks Alaska Department of Education and Early Development NOAA

Photographs courtesy of Reid Brewer, Verena Gill, Heloise Chenelot, Stephen Trumble, and David Menke.

The contents of this website were developed with the assistance of Title II, Part B, Mathematics and Science Partnership Program federal funds from the Alaska Department of Education & Early Development. However, these contents do not necessarily represent the policy of the Department of Education & Early Development, and you should not assume endorsement by the Federal Government.

The University of Alaska Fairbanks is an AA/EO employer and educational institution and prohibits illegal discrimination against any individual: Learn more about UA's notice of nondiscrimination.

Help Using This Site
 

© 2007–2024 Alaska Sea Grant

The University of Alaska Fairbanks is an AA/EO employer and educational institution and prohibits illegal discrimination against any individual: Learn more about UA's notice of nondiscrimination.