
Investigation

Engage:
- Ball of yarn or length of line
- Food web cards
- Spotting scopes
- Shorebird Bingo
- Laminated Bird ID field guides
- Marine Invertebrate ID field cards
- Quadrats (see directions )
- Large kitchen trays
- Trowel or Shovel
- Ice cube trays
- Rulers
- Clipboards, pencils
- Modeling materials (Paper, clay, markers, etc.)
NGSS Performance Expectation
Students who demonstrate understanding can:
Objectives
- energy in the food consumed by shorebirds was once energy from the sun.
- shorebirds and other migratory animals participate in the movement of matter between among plants, animals, decomposers, and the environment; they also use energy during migration to transport matter into and out of local ecosystems.
- shorebirds that migrate to Alaska are important components of healthy ecosystems because they contribute to a relatively stable web of life.
- construct a shorebird food web model that describes the flow of energy, starting with the sun, through the food web and the movement of matter among plants, animals, decomposers, and the environment.
- argue from evidence, data, or a model whether or not an ecosystem is healthy.
This unit was adapted by one developed by Lauren Bien, an educator for the Prince William Science Center (PWSSC), to describe the field trip activities PWSSC provides for Cordova classes during the shorebird migration and accompanying Copper River Shorebird Festival. If you want to focus on shorebirds, you will need to find out the best places for students to view them during spring near your school. You can also contact local organizations and birders to volunteer for bird-viewing and identification. If you have an organization like PWSSC that conducts bird research, they may be able to set up a mist net station and train volunteers in the proper set-up and release of birds from the net and methods for collecting data about shorebirds.
Shorebirds are harvested by some Alaska hunters under regulations set each year by the U.S. Fish and Wildlife Service.
Scout the field trip location, check the local tide chart for the best times for viewing shorebirds during the hours on either side of high tide. Review options for sampling methods and gather equipment needed for the method you select for your site. Depending on the method you select, you may need hand trowels or shovels.
A density quadrat is a frame used by marine biologists to perform counts of the density of organisms or the percentage of cover in a standard area. You may use quadrats made with four 1-meter sticks for an area of one square meter, or you may use quadrats that are smaller. Hula hoops also work as quadrats if you have access to those. A scientist always knows the area of his or her quadrat, since it is used for sampling and making estimates of what will be found in a bigger area.
 To make a ¼ square meter quadrat, use PVC tubing and elbow joints. Cut tubing so that the inside dimensions of your square measure 25 cm x 25 cm. You will need one quadrat for each group of sampling students.
To make a frequency quadrat, use PVC tubing and elbow joints, cut tubing so that the inside dimensions of you square measure 50 cm X 50 cm. Divide your quadrat into 25 equal squares marked with string or cord. You will need one quadrat for each group of sampling students.Review the preparation and procedures for the Shorebird Food Web activity. Make copies of the Food Web Cards (on card stock, if possible) for the type of habitat at the field trip site (mudflats, salt marsh, rocky intertidal habitat, tundra habitat). Make copies or prepare science notebook pages for Shorebird Bingo and either the Frequency Count Datasheet or the Density Count Datasheet, whichever is needed for the survey method.
ENGAGE
(20-30 min)
1. Introduce students to bird migration and, in particular, that of shorebirds, small birds who migrate long distances during spring and summer between their wintering grounds and their breeding areas in Alaska. Show the video about the Cordova Shorebird Festival which includes footage of large numbers of shorebirds of different species, shorebirds feeding on mudflats, and an introduction to the energy needs of shorebirds during migration.
2. Ask students:
Why might shorebirds stop off here? (to eat)
Do you think they have to stop here? (Yes, it takes energy for a small bird to fly long distances, so they need to “re-fuel.”)
3. Explain to students that they will be observing the components of a shorebird stopover point by looking for clues about their food web. They will observe the shorebirds, practice identifying them and their behavior and also look for and identify their food.
EXPLORE: Shorebird Food Web Activity
(30 mins.)
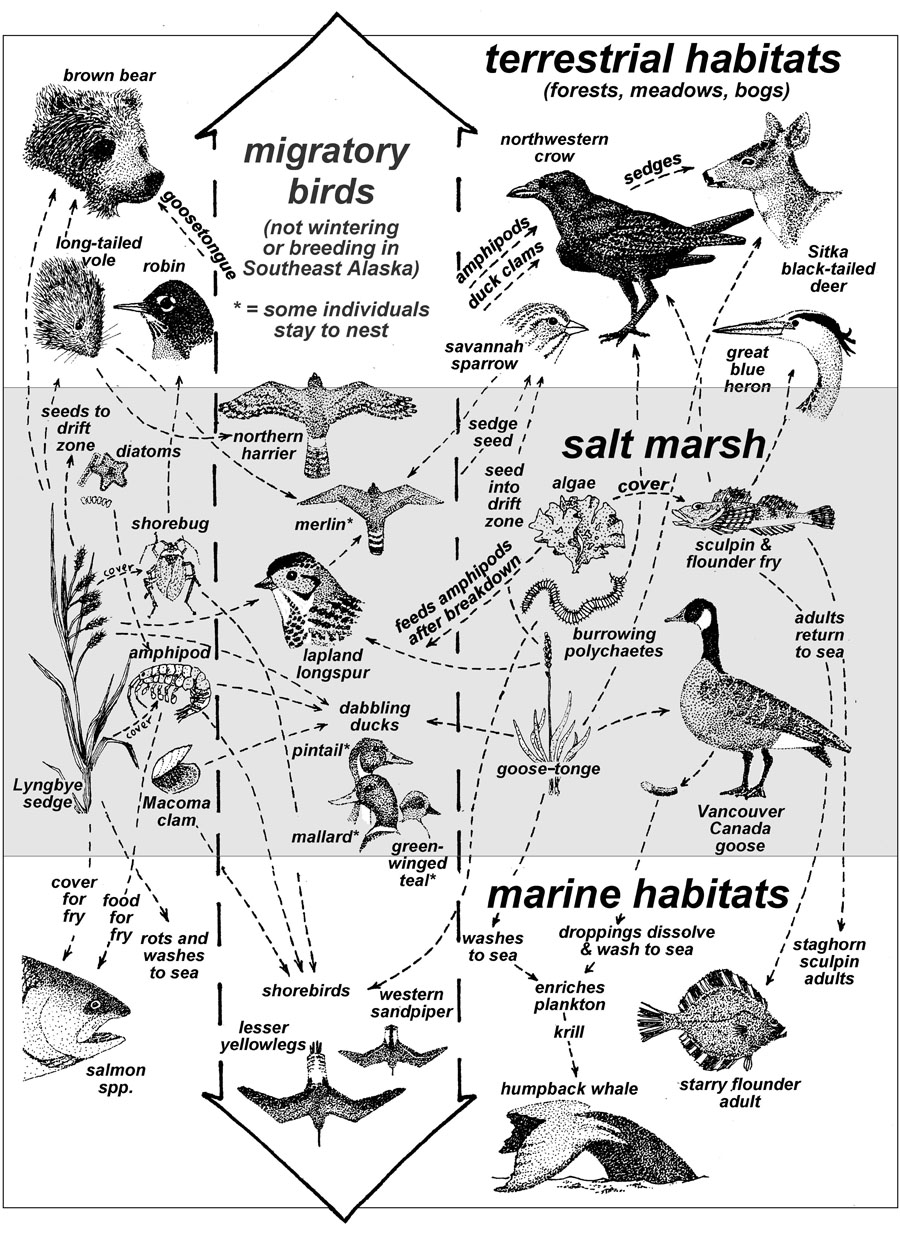
Follow the directions for the Shorebird Food Web activity to do a webbing activity for the type of ecosystem you will be visiting on your field trip (salt marsh, rocky beach, mudflats, tundra).
Please Note: While students may have done webbing activities in earlier grades, this activity has been adapted to emphasize the movement of matter and flow of energy through the ecosystem.
ELABORATE
If you choose not to do the webbing the activity, discuss the following questions as a class.
1. In what ways is matter moved through the ecosystems that shorebirds migrate through? (food web transfers up food chains, recycling of the matter of dead organisms by decomposers into nutrients used by producers in photosynthesis, breathing molecules of carbon dioxide and oxygen, etc.)
2. Emphasize that all detrivores (animals that eat other dead organisms) are consumers and some, but not all, are decomposers (e.g., bacteria, fungi) who break down organic matter into minerals that can be used by plants in photosynthesis. Contrast the role of decomposition in recycling matter with the loss of energy that happens at each stage of a food chain and level of a food web.
3. How does energy flow through an ecosystem? (It originates from the sun and flows only upward in the food web and isn’t recycled.)
4. Ask students if they think an ecosystem with a lot of connections is more “healthy” than one with fewer. After some discussion about how to define the health of an ecosystem, provide the definition of a healthy ecosystem as one in which “multiple species of different types are each able to meet their needs in a relatively stable web of life.” Ask them what would happen if shorebirds were removed from their food webs.
Field Trip
(3-4 hours)
EXPLORE: Migration Madness Field Trip
(three 30-minute station rotations)
When you arrive at the field trip site, look for, and point out, shorebirds or other migratory birds the students can observe. Ask:
Why are these birds here? (To eat!)
What are they eating? (Invertebrates!)
What do these invertebrates eat? (Plankton-Phytoplankton)
What do phytoplankton eat? (They don’t, they get their energy from the Sun!)
You can do the two following activities either sequentially or at the same time if you have enough instructors and volunteers to set up two different stations. If you will have two different stations, bring the students back together after their exploration time and demonstrate the use of the type of quadrat they’ll be using at the shorebird food station.
Spot that bird! Shorebird Bingo. Students use spotting scopes and the shorebird identification cards or bird field guides to complete shorebird bingo. Ask students to pay particular attention to the behavior of shorebirds: Ask: Are they feeding? What are they eating? Plants or animals? Can you see how they feed? Where are they feeding? Do different birds seem to be eating different things or in different places?
Macroinvertebrate and Macro-algae Madness (frequency quadrat sampling and identification)
Explain to students that they will be using a quadrat to investigate what shorebirds are eating and how abundant the other animals they consume are on the beach. They will first use their trowels or shovels in very small areas to investigate what types of animals live in burrows whose holes (and often fecal pellets) they can see on the surface.
Use the method that will work best at your field trip site in the time you have available:
Method 1: Biodiversity Sampling for All Types of Beaches with Burrowing Animals (Density Quadrat)
1. Explain that in order to avoid a bias in our sampling students will be tossing the quadrat randomly. Demonstrate proper quadrat tossing techniques by tossing one back over your shoulder. (You can look first to be sure if won’t land on a boulder on in water.)
2. Students toss their quadrats and use the grid to enter data and in a Density Quadrat Datasheet and estimate the percentage of the quadrat that includes algae/seaweeds or animals on the surface. They then use shovels (large or small, depending on the type of beach) to dig up the top inch or two of sediment from their entire quadrat area and place the sediment on their tray.
3. They look for invertebrates in the trays and place them in ice cube trays for identification using the field ID guides.
4. They repeat quadrat sampling two more times.
Method 2: Biodiversity Sampling for Sandy and Muddy Beaches
1. Students focus their efforts on the most common burrows and castings seen during the free exploration. Before they dig down below they should make some basic observations in their notebooks about the hole or casting. They record the following:
1) Clarity and shape of outline of hole
2) Presence and/or shape of fecal pellets or castings
3) Presence and/or shape of adjacent mounds of sediment
4) Presence and or type of visible tentacles or siphon
5) The width of the hole or casting
6) Arrangement of other related holes
2. Students use hand trowels to dig down below the various holes and identify which invertebrate is associated with which holes. In each group, there will be a Recorder, Photographer, and Digger. After recording these observations and doing a quick sketch of the burrow or casting, students take a picture with the ruler next to the hole or casting to give a size comparison. (They should record the picture number down on their notebooks for later reference.) If cameras aren’t available, students can make a more in-depth sketch, time permitting.
3. Once the students have recorded this information and taken the picture, they carefully dig down under the hole or casting to try to identify which burrowing macroinvertebrate is creating the burrow or casting. Often times it is best to come in at an angle to the hole/casting instead of digging directly down on the hole/casting. If the students are not able to clearly identify the associated invertebrate, the should repeat the digging process with an identical hole or casting until the students are convinced they have found the organism that is creating the sediment formation they are identifying. They can also take a picture of the each organism.
4. Using the marine invertebrate guides, the students should strive to identify five different burrowing organisms. Students can switch group roles (recorder, photographer, and digger) with each new burrow or casting they are trying to identify.
5. Students then sample an area of the beach where they have observed evidence of burrowing animals using a Frequency Count Quadrat three times.
To estimate algae/seaweed cover, students do a frequency count and enter data into the Frequency Count Quadrat (i.e., the number of small quadrants that have algae or seaweeds that have zero, 25%, 50%, 75%, or 100% cover).
Within the quadrat, students also do a density count of individual holes/castings for species they were able to identify earlier [e.g., Macoma clams, other soft-shelled clams, razor clams, fat innkeepers, lugworms (don't worry that they form two holes/ organism; this can be divided out later)] and any other burrowing invertebrates that leaves large well-spaced holes. They enter this data into the Density Count Datasheet.
If some species like eelgrass and Macoma clams are especially abundant, students can do a frequency count instead of a density count for that species by counting the number of “squares” in the frequency quadrat with 100% cover (each 0.5 m2 quadrat is subdivided into 25 smaller squares or quadrats) rather than individuals. It’s important to be careful when counting eelgrass to make sure that students are only counting quadrants that have attached eelgrass.
Students repeat the quadrat counts three times. Back in the classroom, they calculate: 1) the average cover of algae/seaweeds for each quadrat count and the average all three counts for algae/seaweed cover and 2) the average density of each burrowing animal they identified based on the three quadrat samples back in the classroom.
Method 3: Frequency Counts for an Abundant Species on a Rocky Beach (Example: mussel beds)
1. Students use only the frequency count method, not the density count method, but toss the quadrat 10 times (students can pool their data) at random in an area where a species is common. They will observe and record “presence” or “absence” in each of the 25 squares of the quadrat and record this data on the Frequency Count Datasheet.
2. Students calculate the frequency of particular species for each quadrat count. For example, if the animal occurs in 10 of the 25 squares, the frequency of 10/25 = .40 for that quadrat. They can average the frequencies from all ten counts back in the classroom.
Method 4: Total Count Sample for Mudflats
Excavate to the depth of a 5-gallon bucket and use a sieve-and-wash method to leave the burrowing organisms on the top of a mesh filter or sieve plate. (This method requires a place to wash the mud through the sieve and dispose of lots of muddy water.)
(Adapted from Discovery Hike for Sandy and Muddy Beaches activity. Gulf of Alaska CoastWalk Curriculum. Center for Alaskan Coastal Studies.)
EXPLAIN
Bring the group back together to talk about what they found, have students start to think about how all the activities they did today are connected.
Ask:
What do all of the elements have in common? (They are part of the food web.)
Where does the food web start? (the Sun)
How does energy flow through the ecosystem? (From the sun “upwards” through producers, consumers and “decomposers.)
How does matter move through shorebirds and the ecosystem? (They eat food and excrete what’s not used, they breath in air and breath out carbon dioxide, they drink water and excrete it, predators eat shorebirds, When shorebirds die, they decompose and the cycle begins again.)
EXTENSION: Mist-Netting Station
Researchers or volunteers could emphasize the use of the ecosystem and the interconnectedness of the shorebird’s migration and the healthy, functioning ecosystem that supports shorebird migration by supplying food. They could also explain why the study of shorebirds and other migratory birds is important, the types of data that scientists collect when they capture birds in mist nets and how the data might be used for to understand bird population dynamics and causes of declines.
ELABORATE
In the classroom have students review their science notebooks and brainstorm some connections between all the elements they found and observed in the field. Brainstorm all the ways shorebirds and other migratory animals connect similar areas over large distances through the movement of matter (They transport matter from place to place. They consume matter in different places and are consumed by predators. When they die, their matter is recycled through the processes of decomposition and photosynthesis. They exchange matter with the environment when they breathe, drink water, and eliminate wastes. Some birds carry seeds in their feathers and feet from place to place as they migrate!)
Students create a food web model of the ecosystem (diagram or diorama with clay animals and artwork) they investigated on their field trip that includes at least two shorebirds. The source of energy (the Sun) needs to be included, the direction of energy flow needs to be represented, and the model should show how matter is recycled in food webs. Producers and consumers need to be labeled. Remind students of the definition of health for an ecosystem as “multiple species of different types are each able to meet their needs in a relatively stable web of life.”
After they complete their food web model, they will respond to the following prompts:I think the ecosystem I investigated is ______________(healthy OR not healthy) based on my observations of _________________________________ and data I collected about _______________________________.
Assessment Rubric:
3 (High conceptual understanding & skills in development and use of models) - The food web model shows multiple connections between ecosystem components; energy flow starts at the Sun; the producers and the consumers are properly labeled. At least three different types of evidence from the field trip support the argument about ecosystem health logically.
2-(Moderate conceptual understanding & skills in development and use of models) The food web model shows limited connections and energy flow may or may not start at the Sun; some producers or consumers are labeled. Two types of evidence from the field trip support the argument logically.
1 (Low conceptual understanding& skills in development and use of models) - Energy flow does not start with the Sun; food web connections are incorrect or nonexistent; producers and consumers are mislabeled or not labeled. Only one type of evidence is provided or the evidence does not support the argument logically.
Migratory animals transport matter into, out of, and within local ecosystems, while also playing a role in using it and eventually recycling when consumed or decomposed within a larger system of similar habitats along migratory pathways.
Millions of shorebirds migrate through Alaska each year to reach their breeding grounds along the Alaska coast and in Interior and Arctic Alaska. They are among the world’s most impressive avian migrants. Some species that nest in remote, high-arctic regions undertake annual, one-way migrations of more than 8,000 miles one-way.
Along their migration route, the shorebirds rely on stopover sites to feed along the way. During spring, large mudflats, salt marshes, and beaches rich in marine macroinvertebrates provide ideal feeding spots for shorebirds to refuel and obtain energy needed for migration and breeding. Shorebirds and other migratory birds are important components of healthy coastal wetland habitats with diverse invertebrate populations.
The ornithologists Paul Ehrlich, David Dobkin, and Darryl Wyhe wrote the following description of shorebird feeding:
“Although crowded together at high tide, shorebirds begin to sort themselves out into preferred feeding habitats as the tide recedes from beaches. Least Sandpipers remain on drier, algae-covered mud; beyond them, Dunlins concentrate on bare, wet mud. Farther out, the long-legged Short-billed Dowitchers wade while rapidly probing the mud beneath the shallow water, accompanied by Greater Yellowlegs skimming prey from the water surface or swinging their bills back and forth to snare small fishes. On sandy, wave-washed soils, Sanderlings dash nimbly back and forth at the very edge of the ebb and flow, probing the sand for tiny shrimp-like crustaceans. Ruddy Turnstones, as their name suggests, fill their bellies in quite a different way -- they turn over rocks and shells to expose concealed prey and sometimes dig deeply into the sand. Oystercatchers, similarly well named, can extract a mussel's meat from between its shells. In a single year, one oystercatcher can consume more than a hundred pounds of mussel meat. Indeed, each day many shorebirds take in about a third of their weight in food. When you see huge mixed-species flocks of shorebirds feeding on an estuary, you can view it as a tribute to the great biological productivity of those environments, and an example of the ways that evolution has managed to limit the degree to which each species must compete with others for its food.”
Recent studies have also shown that various species of sandpipers and plovers ingest biofilms that are a collection of micro-organisms that adhere to one another in a complex colony and appear as a thin slimy layer on the surface of sand or mud close to water and give it a shiny gloss. One study concluded that Western Sandpipers, one of Alaska’s most abundant shorebird migrant, get half of their daily energy from the nutritious biofilm during migration on average. The sandpipers pick up tiny balls of biofilm with their feathery tongues and the tips of their bills before quickly swallowing it and going for another bite.
Many populations of shorebird species are thought to be declining in North America. Wetland development, urbanization, changing climates, and extreme weather are known to influence shorebird populations, but there is still a lot we don’t understand about how shorebirds use particular habitats. If a shorebird’s food web is disrupted it may not be able to make it to the breeding ground
Prior Student Knowledge:
Students should have experience constructing food chains and have been introduced to the concept of food webs. For calculations related to the frequency count method, students will need to calculate an average. For calculations related to the density count method, they will need to be able to convert percentages (25%, 50%, and 75%) into fractions, add fractions, and calculate an average. You can also modify the activity to use only fractions.
Possible learner preconceptions, misconceptions and instructional clarifications:
Learner Preconception/misconception: Shorebirds eat insects they catch in the air.
Instructional Clarification: Shorebirds can be observed on beaches or other muddy and sandy areas because they use their bills to probe for clams and worms that burrow into the substrate.
Learner Preconception/misconception: Shorebirds and other migratory birds are only part of local ecosystems.
Instructional Clarification: Migratory birds feed on the same types of food throughout the year, but by migrating between winter and summer areas, they are involved in energy flow through similar local ecosystems over a large geographic area. As they migrate during the spring, they use energy from the food they consume in different places along the coast to survive, grow, and reproduce. They also use energy from the food they consume on their breeding grounds to accumulate fat for fall migration.
Components of Next Generation Science Standards Addressed
LS1.C: Organization for Matter and Energy Flow in Organisms
Plants acquire their material for growth chiefly from air and water. (5-LS1-1)
Food provides animals with the materials they need for body repair and growth and the energy they need to maintain body warmth and for motion. (secondary to 5-PS3-1)
LS2.A: Interdependent Relationships in Ecosystems
The food of almost any kind of animal can be traced back to plants. Organisms are related in food webs in which some animals eat plants for food and other animals eat the animals that eat plants. Some organisms, such as fungi and bacteria, break down dead organisms (both plants or plants parts and animals) and therefore operate as “decomposers.” Decomposition eventually restores (recycles) some materials back to the soil. Organisms can survive only in environments in which their particular needs are met. A healthy ecosystem is one in which multiple species of different types are each able to meet their needs in a relatively stable web of life. Newly introduced species can damage the balance of an ecosystem. (5-LS2-1)
Common Core
SL.5.5 - Include multimedia components (e.g., graphics, sound) and visual displays in presentations when appropriate to enhance the development of main ideas or themes. (5-LS2-1)
MP.4 - Model with mathematics. (5-LS2-1)


