Investigation 3 - Mountains in the Sea
|
Class Time Required |
6-7 class periods |
|
|
| Two to three hours to read, watch videos, prepare the videos and illustrations for projection, make handouts, gather materials, try activities and create examples. | |
|
Prior Student Knowledge |
Basic concepts of mountain formation and of plate tectonics. Experience with grid systems. |
|
Vocabulary |
Hydrographic survey, sonar, multi beam sonar, sidescan sonar, bathemetry, topographic maps, contour line, biological productivity, Global Positioning System, concentric topography,tectonic, seamount, magma, enigmatic, endemic |
| Science GLEs Addressed |
6th Grade: SA1.1, SA1.2, SD2.3, SE1.1, SE2.1, SE2.2, SE3.1 7th Grade: SA1.1, SA1.2, SD2.2, SE2.2, SE3.1 8th Grade: SA1.1, SA1.2, SD2.1, SE2.2, SE3.1 |
 Overview:
In this 6-7 day investigation, students begin with an introduction to seamounts that are present in the Gulf of Alaska. They learn how seamounts were formed and look at a bathymetric map of a seamount. In Activity 3A, students explore sea floor mapping techniques as they participate in an activity to create a map of a sea feature they have molded out of clay. In Activity 3B, students watch a short animated presentation, "Who cares about Sea Floor Mapping?" then create a model of a seamount found in Alaska. They use pre-sonar techniques to collect data and create a graph of their seamount using Excel.
Focus Questions:
Why is it important to map the sea floor?
What are some ways that are used to map the sea floor?
How are sea floor features like seamounts formed?
Engagement: (45-50 minutes)
Review with students what they have learned about some amazing and important deep-sea canyons in Alaska waters. Tell them there are also mountains in the sea.
Introduce students to the term "seamount". After reviewing the three basic ways that mountains are formed on land (folding, faulting, and volcanic eruptions), ask students to think about how mountains in the sea might be formed.
Describe the general process of seamount formation. You may need to review the concept of plate tectonics, if students are unfamiliar with this idea and the relevant terms. See Teacher Background for more information.
Show the Seamounts video (Lesson 15 from NOAA’s Learning Demos).
Underwater footage of seamounts and life around them can also be shown from the NOAA Exploration of Alaska's seamounts. Links to photos, slideshows and videos can be found at the Exploring Alaska's Seamounts website.
Discuss the video(s) and the important ideas that were presented. Seamounts are undersea mountains that are usually of volcanic origin. Around these seamounts there is usually a lot of sea life, compared to the surrounding ocean environment. Explain that there are several seamounts that have been discovered in the Gulf of Alaska. Many of these seamounts occur in long chains that parallel the west coast of the U.S. and Canada. One of the longest chains is known as the Axial-Cobb-Eikelberg-Patton chain. Seamounts are exciting places to explore! During a 1999 expedition to the Patton Seamount, researchers discovered a large crab species previously unknown in Alaska, as well as many other invertebrate species that are new to science.
Show students the movie of the simulated fly-around Patton seamount.
The following information is adapted from NOAA Ocean Explorer lesson “Mapping Seamounts in the Gulf of Alaska,” http://oceanexplorer.noaa.gov.
Tell students the following information:
In 2002, geologists and biologists used the manned submersible Alvin to take samples and make observations. They wanted to discover what animals and plants inhabit the seamounts, how the seamounts were formed, and what clues they might provide about global climate change. Because underwater time is always severely limited, and every dive had to be carefully planned, the scientists had to ensure that the submersible could go directly to places on the seamounts that were most likely to provide the information the scientists needed. So before the dives could take place, the seamounts needed to be mapped. Maps would help scientists locate the best places to collect samples and to identify unusual features that needed additional study.
Maps of the ocean are called bathymetric charts. Ask students to share knowledge and experience with nautical charts, and of topographic maps, which are similar to bathymetric maps. Show students the bathymetric map of Patton Seamount.
Activty 3A: Bathymetric Mapping
This activity is adapted from “A Watered Down Topographic Map,” a NOAA Ocean Explorer Activity from http://www.oceanexplorer.noaa.gov.
This activity will help students understand the lines and colors found on a bathymetric map or chart. It introduces them to contour maps--both bathymetric and topographic--and it introduces them to the geologic features that many explorers study. Bathymetric mapping is a major part of many of the Ocean Explorer expeditions since our understanding of the ocean floor starts with knowing what it looks like.
Exploration (70-80 minutes)
1. Distribute the plastic food storage containers and sticks of clay to each group. Each group should build a clay model of the ocean floor with one prominent ocean feature. The model may not extend above the top of the container. For ease of construction, they may assemble them on the desk and then install them in the container.
Show or distribute a copy of the Ocean Features diagram.
2. Challenge the students to create a two-dimensional map of their three-dimensional underwater feature that would visually interpret it for other groups of students. Help them think this through as a group. Draw a large circular shape on the board. Ask the students what they think the drawing represents. Guide the answers, if necessary, toward maps of landforms, such as a pond, an island, a racetrack circuit, and so on. Could it be the base of an underwater mountain? Draw a side view of an undulating mountain directly below and matching the horizontal margins of the circle. Tell the students the two drawings represent the same thing, but from a different perspective. Ask the students again what they think the circular shape and the new side view of the circular shape represents. A mountain should be one of the obvious answers. How can we combine the two dimensions of the circle with the third dimension--height--in the second drawing on a flat map?
3. Distribute the Bathymetric Mapping Instructions and ask students to carefully follow the instructions. When the equipment is ready, have the students check with you to make sure they set up correctly. Depending on your students’ abilities, you may have all setups complete and proceed as a class through drawing of the contour line. Some classes will take off and do this very well on their own. After they complete the first contour line, have the class add water to the first centimeter mark on the ruler closest to the bottom of the container, reminding them to take care when pouring the water into the funnel and pour SLOWLY, so they can be very accurate in their measurement. Once they draw the second contour line they may work at their own speed, completing Part 1 of this activity.
5. When the “maps” are completed, re-introduce the terms topographic and bathymetric maps and discuss contour lines to make sure the concept is clear. On these maps, areas with the same depth are connected by lines, so that mountains are shown as a series of concentric, irregular closed curves. Curves that are close together indicate steep topography, while curves that are farther apart show more gentle slopes.
Show the black and white bathymetric map of the Patton Seamount. Then show the color version of the same map. Note the color key at the bottom of the map. Ask students if the color helps them read the map easier.
6. Now ask students to complete Part 2 of the instructions. They will have a color map showing the feature(s) that they created.
Explanation: (20 minutes)
Display the models in a location where students can easily see them. Display one of the student maps on the overhead projector and ask students to choose the model that it represents. Continue with the remainder of the maps and discuss as necessary.
Elaboration:(20 - 30 minutes)
Show a bathymetric map of a new area and ask students to describe what the contour lines reveal.
If possible, show students a topographic map of a local area, and ask them to point out local features.
Activity 3B: Mapping the Sea floor
This activity leads students through a process of creating a model of the ocean floor, taking depth “soundings,” entering data into an Excel spreadsheet, and then creating a 3-D map of their ocean floor in Excel.
Engagement: (30 minutes)
Ask the following questions, accepting all student ideas: How might scientists map the seamounts? What are some reasons that having a map of the seamounts and/or of the ocean floor might be helpful?
Show students the animated presentation "Who Cares about Seafloor Mapping?" This animation gives a brief history of sea floor mapping techniques, and explains multibeam and sidescan sonar.
During the presentation, pause for discussion at each of the “Did you know?” sections at the bottoms of the pages. Stop after you have read and discussed the page that describes LIDAR. Review sound waves, sonar, sidescan sonar, and multibeam sonar to be sure students have a basic understanding.
If students need more background on sound and how sound travels, see the Teacher Background section for resources.
Exploration: (2-3 class periods)
Tell students they are going to create a model of a seamount or chain of seamounts and the surrounding ocean floor, then participate in a simulation of a sonar activity.
Remind students that canyons and seamounts are not the only structures found at the bottom of the ocean. Show them the Ocean Features diagram, noting the various features such as continental shelf, continental slope, abyssal plain, seamount, island, rift zone, mid-ocean ridge, and oceanic trench.
Part 1: Creating the Seafloor Model (60-70 minutes)
Divide students into groups of 2-3. Each group will build a sounding box, using the model seafloor instructions handout, Part 1. Have each team of students place rocks, sand, clay, and/or other materials in their box to create models of the ocean floor. They should include at least one seamount. Other ocean features mentioned above are optional. (To adapt this lesson for a range of learning styles and abilities, students can create their model seafloor using more familiar terms such as canyons, islands, or mountains.)
Each student should then draw a diagram of their model seafloor in their science notebook, labeling the features of the ocean floor.
If the box does not have a lid, secure aluminum foil or construction paper over the top.
Part 2: Sampling the Seafloor (30-40 min)
Be sure students have directions for Part 2.
Each team will tape a seafloor grid to the top of their box. The letters and numbers will form a system for referencing each square. For example the square in the upper left corner will be “A1,” etc. Each team needs several copies of the grid: one for the top of the box, and one for each team member to be used for data collection and making the map.
Distribute or have students select items to use as probes (skewers, knitting needles, pencils, straws, etc.). Use centimeter rulers and markers to create measuring instruments by placing marks in centimeter increments. As an alternate method, students can hold their finger at the box-top level of the probe when it has reached the bottom of the “ocean floor,” then lay the probe down along the edge of the ruler to measure the distance. Be sure that they record the distances on their second grid as negative numbers to indicate depth below the surface.
Remind students to began their data sampling in a systematic way. Suggest they start at one corner and continue along one line until all data are collected for that line, then start collecting data for the next line.
When they have taken readings for all the holes in the top of the box, they will have a grid with a number in each square.
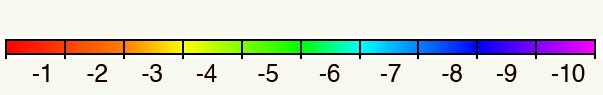
Ask students to use the color chart on their handout, and color each square with the color that corresponds to the depth.
Next, ask them to draw lines that connect the squares that have the same colors to show what features are on their seafloor.
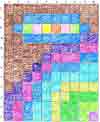
Then draw a line through the middle of each square to create the "contour lines".

Finally, ask them to take the top off the box and see if their graph looks like the model!
Explanation: (30 min)
Ask students if their sampling found all of the features on the bottom of their seafloor. Why or why not?
Display the models in a location where students can easily see them. Display the student maps and ask students to choose the model that it represents, explaining their choice.
Lead a discussion asking students to explain how this activity was similar to sonar in the “transect” method of sampling, and taking depth “soundings.” How would scientists use this information when planning for their dive? Discuss the advantages of various locations for diving missions or routes for a submarine to explore the bottom of the ocean. Hint: Areas likely to offer a variety of habitat types within a short distance will offer some of the best opportunities to get the most out of limited diving or submarine time. (Flat regions are more likely to have accumulations of sediment, and will provide different habitats than very steep areas. On the other hand, steep areas obviously have a greater range of depths within a short distance, so these are better sites to study how depth influences the distribution of various species.)
Elaboration: (30 minutes)
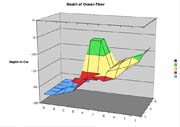
Have students create a 3-D map showing the topography of the ocean floor using Excel and the instructions provided. It might be helpful to demonstrate with the sample data provided.
Ask students if they can come up with other ideas of gathering the same data they did with the sampling tool.
Evaluation:
Ask students to respond to the following questions in their science notebooks.
It has been said that sound is the "eyes" of the ocean. What might this mean?
You might also ask them to respond to one or more of the following:
1. Explain the difference between topographic and bathymetric maps.
2. Discuss how sonar can be used as a tool to map the ocean bottom.
3. Explain how hydrographic surveying has changed with the introduction of new technologies.
4. What type of old hydrographic surveying method is most like the sounding box activity?
5. How would you change your measurement method to find smaller objects, or to find more detail in the large objects on the bottom of your ocean?
6. In your opinion is sonar mapping an accurate way to measure the ocean floor? Explain why or why not.
Extensions:
“Forests of the Deep” is a NOAA Ocean Explorer activity focusing on deep-sea coral communities associated with seamounts in Alaska. Students research ways in which seamounts are important to biological communities.
Ask students to refer to the map they constructed for the box they sampled, and develop a “dive plan” for scientists in a submarine. The scientists will want to spend as much time as possible viewing and sampling the habitats around the seamount.
Invite a fisherman or boat captain to explain how sonar is used on their boat.
Have students find landmarks and important features on a topographic map of their own area.
Read stories about boats that have gone aground and discuss whether sonar technology could have prevented the accident.
Teacher Preparation
|
Tips from Teachers |
|
As a pre-assessment, ask students to look at and compare different types of maps and record the similarities and differences in their science notebooks. |
Read through all of the investigation, background materials, and supplementary materials, and watch videos. Gather supplies, try out the activities, and create examples of the bathymetric map and/or sounding box if desired. Prepare to show videos and illustrations. Print and copy the student handouts.
Curricular Connections
Social Studies/Geography. Mapping can be connected to social studies and the study of longitude and latitude.
Math. The use of grid systems connects to math.
Technology. The use of spreadsheets and charts in Excel is a good application of technology.
The investigation also provides opportunities for writing.
Ideas for adapting to different local environment or context:
Water is not required for this activity but can be used in plastic containers. Food coloring can be added to water to make water too dark for students to see to the bottom.
Students might also go outdoors to map a shallow part of a river or pond if a grid area is marked out. They could do a series of soundings on transect lines placed a set distance apart along the shore of a pond to construct grid data. They could also do a series of stream profiles by laying a tape across a small stream (100 m tape) and measuring at regular intervals along the tape with a meter stick.
| Student Handouts | |
| Items for Group Display |
"Who Cares about Seafloor Mapping?" |
| Material Items |
Activity 3A:
Activtiy 3B:
|
| Facility/Equipment Requirements |
Computer(s) with Internet access |
Alaska Science Standards and Grade Level Expectations Addressed:
6th Grade:
The student demonstrates an understanding of the processes of science by
SA1.1 asking questions, predicting, observing, describing, measuring, classifying, making generalizations, inferring, and communicating.*
SA1.2 collaborating to design and conduct simple repeatable investigations (L).
The student demonstrates an understanding of the forces that shape Earth by
SD2.3 describing how the surface can change rapidly as a result of geological activities (i.e., earthquakes, tsunamis, volcanoes, floods, landslides, avalanches)
The student demonstrates an understanding of how to integrate scientific knowledge and technology to address problems by
SE1.1 recognizing that technology cannot always provide successful solutions for problems or fulfill every human need.
The student demonstrates an understanding that solving problems involves different ways of thinking by
SE2.1 identifying and designing a solution to a problem.
SE2.2 comparing the student’s work to the work of peers in order to identify multiple paths that can be used to investigate a question or problem. (L)
The student demonstrates an understanding of how scientific discoveries and technological innovations affect our lives and society by
SE3.1 describing the various effects of an innovation on a global level.
7th Grade:
The student demonstrates an understanding of the processes of science by
SA1.1 asking questions, predicting, observing, describing, measuring, classifying, making generalizations, inferring, and communicating.*
SA1.2 collaborating to design and conduct simple repeatable investigations, in order to record, analyze (i.e., range, mean, median, mode), interpret data, and present findings (L).
The student demonstrates an understanding of the forces that shape Earth by
SD2.2 describing how the movement of the tectonic plates results in both slow changes (e.g., formation of mountains, ocean floors, and basins) and short-term events (e.g., volcanic eruptions, seismic waves, and earthquakes) on the surface.
The student demonstrates an understanding that solving problems involves different ways of thinking by
SE2.2 comparing the student’s work to the work of peers in order to identify multiple paths that can be used to investigate a question or problem.* (L)
The student demonstrates an understanding of how scientific discoveries and technological innovations affect our lives and society by
SE3.1 recognizing the effects of a past scientific discovery, invention, or scientific breakthrough (e.g., DDT, internal combustion engine).
8th Grade:
The student demonstrates an understanding of the processes of science by
SA1.1 asking questions, predicting, observing, describing, measuring, classifying, making generalizations, inferring, and communicating.*
SA1.2 collaborating to design and conduct repeatable investigations, in order to record, analyze (i.e., range, mean, median, mode), interpret data, and present findings (L).
The student demonstrates an understanding of the forces that shape Earth by
SD2.1 interpreting topographical maps to identify features (i.e., rivers, lakes, mountains, valleys, islands, and tundra).
The student demonstrates an understanding that solving problems involves different ways of thinking by
SE2.2 comparing the student’s work to the work of peers in order to identify multiple paths that can be used to investigate and evaluate potential solutions to a question or problem (L).
The student demonstrates an understanding of how scientific discoveries and technological innovations affect our lives and society by
SE3.1 predicting the possible effects of a recent scientific discovery, invention, or scientific breakthrough (L).
Essential Questions:
Enduring Understandings:
|


