
Books
Burns, Loree Griffin. Tracking trash; Flotsam, jetsam, and the science of ocean motion. Houghton Mifflin, 2007.
Teachers Guides
Barber, J., Buegler, M., Lowell, L., and Willard, C. Discovering Density. Lawrence Hall of Science, 2001.
Halversen, Catherine. Ocean Currents. Lawrence Hall of Science, 2001.
Halversen, Catherine. Only One Ocean. Lawrence Hall of Science, 2003.
Online Resources
Investigation 1: Where Did the Rubber Bath Toys Go?
Story about the Rubber Duckies
Investigation 2: Weather and Circulation Systems
Socratic Seminars
Socratic Seminar Overview
Socratic seminars: engaging students in intellectual discourse
Currents Tutorial from NOAA
Surface Ocean Currents
Ocean Odyssey – Density Current video from NASASciFiles
Covers density, salinity, currents
Ocean Odyssey – Surface Currents video from NASASciFiles
Global current image
Global isobaric patterns for July and Sept.
Ocean Circulation article
Global ocean current circulation animation:
Global wind speed Jan and July plus an animation
NOAA National Data Buoy Center
Ocean Currents and The Distribution of Life
Wind Driven Surface Currents, Gyres Background:
Coriolis Effect lesson plan
Investigation 3: Waves and Tides
Story about a cruise ship stuck at low tide
Description of the hazards on the Turnagain mudflats
Story of a fisherman in Anchorage getting trapped at low tide
NOAA Ocean Service Education
Tides and Water Levels lesson plans
If students need more learning activities centered around tides to better understand the concepts, NOAA has lesson plans: Tides: Ups and Downs
Tides and Moon with time-lapse and marigrams
Kachemak Bay tidal cycle: the movie (time-lapse of Kachemak Bay extreme tidal cycle)
Ocean Odyssey – Tides and Waves video from NASASciFiles
Ocean Tides at the Bay of Fundy video
From: Britannica Online
Waves Includes information and interactive wave section
Investigation 4: Temperature and Salinity Effects on Deep Ocean Currents
On-line sources for Tornado Tubes
Tornadotube.net
Edmund Scientifics
eBay
Investigation 5: Seafloor Topography
Sea Bottom Features – draining the Atlantic and Pacific Oceans.
Investigation 6: Debris Detectives Field Trip
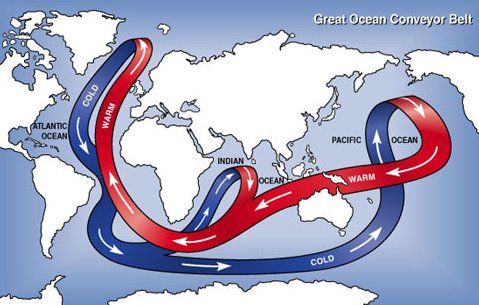
Investigation 7: Global Conveyor Belt
Global conveyor belt audio radio show
Oceanic Conveyor Belt background
Turning the Tides video
Hypothetical Landmass resources:
Pangaea Supercontinent
Pangaea: Wikipedia
Exxon Valdez Oil Spill resources
Hiebauer, H.J., T.C. Royer and T.J> Weingartner: JOURNAL OF GEOPHYSICAL RESEARCH, VOL. 99, NO. C7, PAGES 14,113–14,126, 1994.
Map showing Bligh Reef and the spill location
NOAA Fisheries Office of Exxon Valdez Oil Spill (EVOS) Damage Assessment and Restoration
Map of where the oil went
The behavior of the oil
Radio show about currents in Prince William Sound
Hypothetical Spill resources
Oil and Chemical Spills
Beach: Nike Shoes Wash Up
LEGOs and Other Floating Flotsam
Flip Flotsam video
Drifter Buoys
Garbage Patch in the Pacific resources
Clean Our Oceans: The Impact of the Great Garbage Patch (additional links on this website)
Trashed: Across the Pacific Ocean, Plastics, Plastics, Everywhere
Why is the world’s biggest landfill in the Pacific Ocean?
Surface Ocean Currents
Wind Driven Surface Currents: Gyres Background
Plastics and Marine Debris video 6 min.
Turning the Tides video
The Garbage Patch video
Gorilla in the Greenhouse: The Great Pacific Garbage Patch


