Teacher Background - Our Changing World
Ocean and stream environments are dynamic. For people living along the coast of Alaska or along its rivers, daily changes are often obvious and they have adapted their lives to the rhythms of change. On the coast and for some distance up large rivers, the tide comes in and goes out twice a day. In places where the ocean is funneled up a narrow channel like Cook Inlet, the tidal range can be extreme when the gravitational pull of the sun and moon are combined. Storms come and go, often with high winds that whip the surface of rivers, lakes, and the ocean into turbulence. Rainy periods cause streams and rivers to rise and flood; dry periods cause them to fall and recede. Break-up and freeze-up are part of an annual cycle throughout much of Alaska, as is the freezing and thawing of sea ice in the Arctic Ocean and Bering Sea and bays in Southcentral Alaska.
The “big picture” of physical changes in marine and aquatic environments over long periods of time has involved cyclic ice ages that affected the entire planet. Long-term reductions in the temperature of the earth’s surface and atmosphere resulted in an expansion of continental ice sheets, polar ice sheets, and alpine glaciers. During ice age peaks, extensive ice sheets were present on what is now Alaska and other areas of the North American and Eurasian continents. Much of the planet’s water was locked in ice, greatly reducing the amount of water in the ocean, thus lowering sea levels, exposing continental shelves, and forming a land bridge between North America and Asia. As the ice thawed, sea levels rose, the shoreline of the continents moved inland, large expanses of land emerged from beneath the receding glaciers, and large rivers were formed that cut their way to the sea. During the last great ice age, much of Alaska and Russia was not glaciated, but was rather dry grassland. This was known as the Mammoth Steppe. (http://www.gi.alaska.edu/ScienceForum/ASF18/1809.html). This stresses one of the important ideas about glaciers, which is that they require more than just cold temperatures to form. They require precipitation in the form of snow.
We are now living in what may be an interglacial period, or between ice ages. The climate is warm enough that the extent of both sea ice and some alpine glaciers are shrinking. Considerable scientific evidence supports the conclusion that the trend of the overall climate of the planet is warming, and at an accelerating rate. This warming pattern can change the conditions for life in Alaska’s aquatic and marine environments, and affect the diversity and productivity of ecosystems that have existed and adapted to conditions only since the peak of the last ice age.
Physical changes and their effects on marine and aquatic ecosystems are the focus of the unit—with an emphasis on changes in the extent of the area covered by ice through the seasons and permanently, as well as changes in the nature of the freshwater that reaches the ocean as glaciers thaw.
According to the National Snow and Ice Data Center, "Arctic sea ice during the 2007 melt season plummeted to the lowest levels since satellite measurements began in 1979. The average sea ice extent for the month of September was 4.28 million square kilometers (1.65 million square miles), the lowest September on record, shattering the previous record for the month, set in 2005, by 23 percent Arctic sea ice extent during the 2008 melt season dropped to the second-lowest level since satellite measurements began in 1979, reaching the lowest point in its annual cycle of melt and growth on September 14, 2008."
The scientific evidence supports the conclusion that these effects are taking place on a global scale, although they are not happening uniformly in every place on the planet. While many glaciers are melting at lower elevation in response to warmer air temperatures and increased rainfall, some glaciers are “fed” at higher elevations, where precipitation falls as snow, and are growing in size. Parts of Alaska have recently experienced seasons that are, on average, colder than in years past, and ocean water temperatures are colder with nearshore ice lingering longer than on average. Overall, however, the planet’s climate appears to have a warming trend. This unit explores the potential effects of a warming climate, particularly one that warms rapidly with respect to the organisms adapted to a cooler regime and large-scale pattern of change.
Among the potential effects of a warming climate and melting sea and glacial ice:
- Less sea ice (smaller area and a later initiation of growth during winter) may mean more open water during the summer with a larger capacity to absorb and store heat, thus increasing the rate of the melting of the sea ice, independent of air temperatures.
- Less sea ice will affect the species of fish and wildlife that are adapted to the current balance and cycle of sea ice, land, and open water.
- Several marine mammals, such as fur seals and walrus, go to land to breed, and then feed along the rich edge of the sea ice pack, so increasing distances of offshore ice may result in starvation of young animals.
- Seabirds, such as the black guillemot, have similar life history strategies, and are beginning to face competition and be displaced by puffins who are invading nesting areas from the south.
- Polar bears and arctic foxes live on the ice pack and hunt or scavenge the seals associated with the ice pack. Prey animals may be fewer and harder to find. With a limited ability to swim long distances, some animals may drown.
- Coastal erosion may increase and higher storm surge flooding would occur. With more open water, larger waves are generated and coastal erosion is escalated.
- Whales that require large concentrations of zooplankton may have more difficulty finding the smaller number of “patches” of zooplankton they prefer, or instead they may find zooplankton that thrive in warmer seas.
- For many species, the timing of food availability is critical and may be altered by climate change.
- Increased freshwater runoff to the ocean may increase flooding and raise sea level.
- The effect of melting glaciers may also have dramatic physical effects on the land, streams, and nearshore areas of the ocean where water runs off the land directly and at the mouths of streams and rivers.
- As glaciers melt back, large amounts of sediment embedded in the glacier or scoured by the increased flows become suspended in the streams or rivers and wash into the ocean. Sediment can greatly reduce or block the penetration of sunlight that fuels aquatic and marine food webs, make food difficult to find for animals that depend on sight, clog the gills of fish, and bury habitat, such as the clean gravel areas needed by salmon for spawning.
Investigation 1: Ch-Ch-Ch-Changes
Climate patterns are dynamic. Mounting scientific evidence is documenting a current warming trend that is being magnified in intensity at the poles. This unit does not seek to engage students in the entirety of this complex topic. Instead, it focuses on one aspect of the dynamics of marine and aquatic environments for which there is currently considerable scientific data on large-scale change—changes in sea ice and glaciers. The activities support exploration of the scientific evidence of change, the processes of change, and possible consequences of a climate trend that may continue to increase the melting of sea ice and glaciers. For an overview of global ice changes in the “cryosphere,” as observed from space, see the seven-minute Cryosphere Movie.
Sea Ice
Sea ice is frozen sea water. (Icebergs are not sea ice because they are fragments of freshwater glaciers). For more information about the characteristics of sea ice and information on the record loss of arctic sea ice during the summers of 2007 and 2008, read the news on the National Snow and Ice Data Center Web site.
Effects of a Warming Climate
A warming climate is expected to result in the increased rate of melting of sea ice and glaciers. Sea level is rising, according scientific evidence, although there is disagreement about how to accurately measure the change and the magnitude of the predicted rate of rise in the future. The melting of sea ice is not expected to contribute significantly to sea level rise for reasons the students will explore in Investigation 1 in this unit. The melting of glaciers and the thermal expansion of water are expected to be the primary processes that will determine the rate of rise. The melting of sea ice will have a significant effect on arctic and subarctic ecosystems, which will be explored in the Bering Sea WebQuest in Investigation 3.
Resources:
Alaska Ocean Observing System. Arctic sea ice animations: Real-time and longer time series real-time or near real-time data on the extent of seasonal ice.
National Snow and Ice Data Center. Daily image of arctic sea ice and time-series graph, and results of recent data analyses.
Global Climate Change NASA's Eyes on the Earth Key Indicators has graphs of historic data on sea level change, ice mass, and other indicators of climate change such as global average temperature, and ozone hole size.
NASA Web site with visualization of arctic sea ice extent, 1979-2007, graphic and graph.
Activity 1B: Melting Sea Ice and Sea Level
Explanation for the results of the experiment: Ice is less dense than water. An ice cube floating in a glass of water displaces the same volume of water that it contains. So, if sea ice were to melt, the sea level would stay the same.
The Arctic region encompasses the Arctic Ocean and the surrounding northern boundaries of several continents (North America, Europe, Asia) and the earth’s largest island, Greenland. Between these landmasses it connects with the other oceans of the world, and thereby has an impact on global weather and climate. Much of the water is covered with sea ice, which increases and decreases seasonally in both thickness and total surface area. While roughly half of the arctic sea ice freezes and melts during this process, the remaining half remains frozen and grows in thickness over many years.
There are two kinds of ice in the polar regions—sea ice and glacier ice in the form of mountain glaciers and ice sheets. Sea ice forms on the top of ocean water and is usually between 1 and 2 meters thick after a cold winter, depending on where you are in the Arctic Ocean. Some of the sea ice melts each summer. Glaciers and ice sheets are formed on land from precipitation that falls and accumulates on the ground. Layers of snow build up, causing pressure on the snow crystals beneath, and the air is pushed out. Eventually the snow is compacted into layers of ice. This ice becomes a glacier that acts like a river, flowing downhill under the pressure of its own weight. Once the glaciers meet the ocean, they break off and become floating icebergs, or extend sometimes hundreds of miles into the ocean as ice shelves.
Be sure that students understand that temperature is not the only control on whether
glaciers grow or shrink. Winter precipitation (snow) is also needed.
You may want to lead a discussion on the relationship between glacier accumulation and ablation (surface melting or iceberg calving). The size of a glacier is controlled by both of these things. Calving accounts for two-thirds of the mass loss from Greenland and an even higher proportion of the mass loss in Antarctica. Furthermore calving is at least partly controlled by changes in ocean temperature and circulation. So not only do glaciers contribute to sea level variations, they are also affected by changes occuring in the oceans. Calving also makes for a captivating subject: there are now many images and videos available of calving icebergs. Videos from work in Greenland can be found at ftp://ftp.gi.alaska.edu/pub/amundson/videos/.
The significance of the rate of melt of Alaska glaciers on a global scale, and the relative contributions of different melt and thermal expansion processes, is the subject of active research and sometimes-conflicting opinions. To see a recent synthesis of research about glaciers, ice sheets, and global sea level rise, see the summary of a lecture by Eric Rignot of the Jet Propulsion Lab in November 2008.
Earthwatch Radio list
Alaska’s Melting Glaciers
Rising Waters (from glaciers)
Sea Ice
National Snow and Ice Data Center Web site
Investigation 2: Impacts of Change in Glacier Ice
Investigation 2 focuses on the consequences of melting glaciers, and
compares the potential sea level effects of glacial melt with melting sea ice. Glacier photos and the Glacier Game
engage students in the investigation of a suite of effects on aquatic
and marine ecosystems. The Stream Table and Transparency/Turbidity
activities provide hands-on experience with physical changes that will
result from glacial melt.
Glaciers
For background on glaciers and the rate and impacts of glacial melt, read the section on glaciers from the National Snow and Ice Data Center. NSIDC data supports the conclusion that the majority of glaciers being monitored worldwide are retreating and the rate of retreat is accelerating.
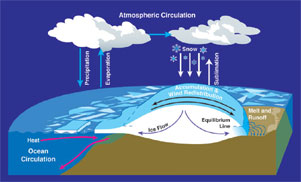
The following diagram can help you visualize the processes that affect the mass balance of a glacier. The left side illustrates a tidewater glacier; the right side illustrates a glacier with runoff into a lake or stream.
Additional Resources:
A nice explanation and photos of glacier topics can be found at Teachers Domain.
NOVA Science Now: Video of the moving Jakobshavn glacier in Greenland
How Glaciers Move. Alaska Science Forum, Article #145
Journey to Alaska’s Glaciers: WebQuest to Explore How Glaciers Shape the Land
Isostatic Rebound
Isostatic rebound is the rise of land masses that were depressed by the huge weight of ice sheets during the last glacial period, through a process known as isostatic depression. It affects northern Europe, especially Scotland and northern Denmark, Siberia, Canada, parts of Alaska, and the Great Lakes region of Canada and the United States. Uplift has taken place in two distinct stages. The initial uplift following deglaciation was rapid (called "elastic"), and took place as the ice was being unloaded. After this "elastic" phase, uplift proceeded by "slow viscous flow," when the rate decreased exponentially. Today, typical uplift rates are of the order of 10 mm per year or less in most places, but are in the range of 10-32 mm per year at some locations in Southeast Alaska. This rebound is important in the context of sea level rise; the rate of rebound may equal or exceed the rate of sea level rise.
Glacier glossary
Activity 2C: Stream Table
What is a stream table? A stream table, most often used in earth science/geology classrooms, is a box-like table, usually containing sand, that is used to show the effects of a stream on land surfaces and features. Different types of streams can be manually produced (braided or meandering) by running fingers through the sand. Students are able to see the concepts of deposition and erosion on the "banks" of the streams formed on the table. Stream tables are available commercially or you can make your own.
How to Make a Stream Table
Materials needed:
- Cookie sheet or foil pan
- Sand
- Potting soil
- Gravel (optional)
- Water source (a bucket with water in it or a watering can)
- Funnel
- Pieces of hose or other soft tubing
- Books or block (to elevate the table)
Cover the cookie sheet with a layer of sand, gravel, or potting soil. Use your finger to roughly etch out a stream. Prop up one end of the cookie sheet to about 3 to 5 cm.
Activity 2D: Transparency/Turbidity
The measure of how much light passes through water is also referred to as turbidity. The particles in water that scatter light may be microscopic plankton, stirred up sediment or organic materials, eroded soil, clay, silt, sand, industrial waste, or sewage. Bottom sediment may be stirred up by such actions as waves or currents, bottom-feeding fish, people swimming or wading, or storm runoff. Clear water may appear cleaner than turbid water, but it is not necessarily healthier. Water may be clear because it has too little dissolved oxygen, too much acidity, or too many contaminants to support aquatic life. Water that is turbid from plankton has both the food and oxygen to support fish and plant life. However, high turbidity may be a symptom of other water quality problems.
Effects of Turbidity
- Turbidity diffuses sunlight and slows photosynthesis. Plants begin to die, reducing the amount of dissolved oxygen and increasing the acidity (decaying organic material produces carbonic acid) which lowers the pH level). Both of these effects harm aquatic animals.
- Turbidity raises water temperature because the suspended particles absorb the sun's heat. Warmer water holds less oxygen, thus increasing the effects of reduced photosynthesis. In addition, some aquatic animals may not adjust well to the warmer water, particularly during the egg and larval stages.
- Highly turbid water can clog the gills of fish, stunt their growth, and decrease their resistance to diseases.
- The organic materials that may cause turbidity can also serve as breeding grounds for pathogenic bacteria. When drinking water reservoirs are turbid, the water treatment plant usually filters the water before disinfecting it.
- Industrial processes and food processing require clear water. Turbid water can clog machines and interfere with making food and beverages.
Causes of Excessive Turbidity
- Algae blooms caused by excess nitrogen (from agricultural runoff, septic tanks, or sewage outflows).
- Weather and seasons can contribute to turbidity. Water that is clear in the spring may grow turbid by August because of plant growth enhanced by warmer days and longer sunlight hours. Similarly, heavy rains or spring snow melts can stir up soil and sediments, increasing turbidity.
- Contamination from sewage, industrial waste, or urban runoff.
Investigation 3: Bering Sea Expedition
Climate Change and the Bering Sea. Information and videos of scientists talking about their research and changes in the Bering Sea.
Understanding Ecosystem Processes in the Bering Sea. For current research information and news about the Bering Sea.


