Alaska Sea Grant
  • Home

Instructional Strategies

Teaching about Controversial Issues
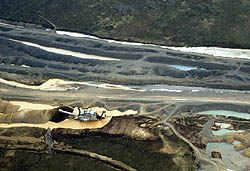
Mining and watersheds - photo courtesy of US Fish and WildlifeSome of the topics explored and investigated in the units may be sensitive and/or controversial, depending on where you are located, what jobs and/or industry the local economy depends on, and what previous conceptions/misconceptions your students may have.

Some guidelines that may be useful for teachers follow:

  1. Present the science objectively, being careful to leave your emotions behind. Research and data can raise students’ awareness and understanding of a topic.
  2. Allow students to discover information and facts on their own, from a variety of sources.
  3. If possible, invite local residents that have first hand knowledge of the topic being discussed. If there are opposing views of an issue, try to find speakers for both sides.
  4. Encourage students to look for both pro and con, positive and negative, if a topic or issue seems to have opposing views.
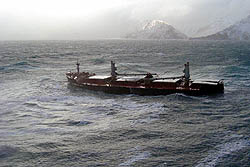
  5. M/V Selendang Ayu Oil Spill Unalaska 2004 - photo courtesy of US Fish and WildlifeEncourage students to look for solutions if an issue/topic seems doomed to a gloomy future.
  6.  If students become passionate about a particular topic, you may need to establish ground rules before classroom discussions take place.

Other web sites:
Instructional Strategies and Tools

Students in the field, photo courtesy of Reid BrewerInstructional Strategies Listed in the Units


Think-Pair-Share is a strategy developed by Frank Lyman and his colleagues in Maryland. It is an easy activity to assess student knowledge and understanding about a topic and/or concept. It is also a nice way to allow students the opportunity to talk with each other in a structured manner, and increase their learning.

Think.
Provide students with a question, observation or writing prompt. Allow a minute or so for them to think individually about the question. Older students may write notes about their thinking.

Pair.
Students pair up to talk about the question or prompt. Pairs can be determined in a variety of ways. Allow a minute or two for them to discuss their thoughts and answers, and decide on one or two that they agree are best, most convincing, or most unique.

Share.
Each pair has the opportunity to share their thinking with the rest of the class.

Back to top

K-W-L Chart
K-W-L is a 3-column chart that helps organize and record Before, During, and After knowledge of a topic or concept. This technique can be done with the whole class on the overhead, chart paper, or chalkboard.
Students can create the table in their science notebook or complete one provided by the teacher, cut it out, and paste it into their notebook.

K

W

L

What do I know about this topic?

What do I want to learn about this topic?   OR
What do I think I will learn?

What have I learned?

This column is completed at the beginning of the unit of study. This provides both the teacher and the student with a baseline of knowledge. As discussion of the topic or unit begins, students complete this column, predicting what they might learn and/or articulating what they would like to learn about the topic. At the end of the unit or topic discussion, students complete this column with their newly gained knowledge and understanding.

A fourth column, “H”, can be added to answer the question, How we can learn more?

See KWL chart for students.

Back to top

O-W-L Chart. The O-W-L chart is basically the same as the KWL chart, except that the first column is Observe. Well suited for younger students

O

W

L

What can I observe about this topic?

What do I want to learn about this topic?

OR

What do I think I will learn?

What have I learned?

This column is completed during an observation activity, usually at the beginning of a topic of study.

As discussion of the topic or unit begins, students complete this column, predicting what they might learn and/or articulating what they would like to learn about the topic.

At the end of the unit or topic discussion, students complete this column with their newly gained knowledge and understanding.

See OWL Chart for students.

Back to top

Compare and Contrast Chart. Comparison and contrast are great ways for students to think about how plants, animals, objects, etc. are alike and different. It encourages them to pay attention to detail. When they compare items, they look for similarities, or things that make them the same. When they contrast items, they look at the differences between them. Students may complete a prepared sheet, or create their own document in their science notebooks. There are other ways to have students compare things and to represent that comparison visually. The Venn diagram is very useful for making comparsons as well as the Box & T-chart.

Start with how things are the same or similar.

The ______ and the _______ are the same because they both


_______________________.

Add one or more similarities.

In addition, they both

________________ and __________.

Explain how they are different. Compare the same property or characteristic in the same sentence.

They are different because the

______, but the ______ does not.

Add one or more contrasting details.

Also, the ________, but the

________________ does not.

See Compare and Contrast Response Chart for Students.

Back to top


3-2-1 Response. As a quick and useful assessment tool, try using a 3-2-1 response with your students. There are several varieties of this strategy. Students can write responses in their science notebooks, then you can quickly check for understanding.

List 3 new facts or words that you have learned today,
List 2 ideas or concepts that are new to you,
List 1 question you still have.

5-3-1.
On your own, identify 5 key ideas, principles or facts.
In pairs, share your list and come up with your top 3.
At your table, or with another pair of students, identify 1 “MVP” (most valuable point) from today.

Back to top
Alaska Sea Grant University of Alaska Fairbanks Alaska Department of Education and Early Development NOAA